U.S. Virgin Islander vs Lumbee Seniors Poverty Over the Age of 75
COMPARE
U.S. Virgin Islander
Lumbee
Seniors Poverty Over the Age of 75
Seniors Poverty Over the Age of 75 Comparison
U.S. Virgin Islanders
Lumbee
15.4%
SENIORS POVERTY OVER THE AGE OF 75
0.0/ 100
METRIC RATING
295th/ 347
METRIC RANK
19.7%
SENIORS POVERTY OVER THE AGE OF 75
0.0/ 100
METRIC RATING
343rd/ 347
METRIC RANK
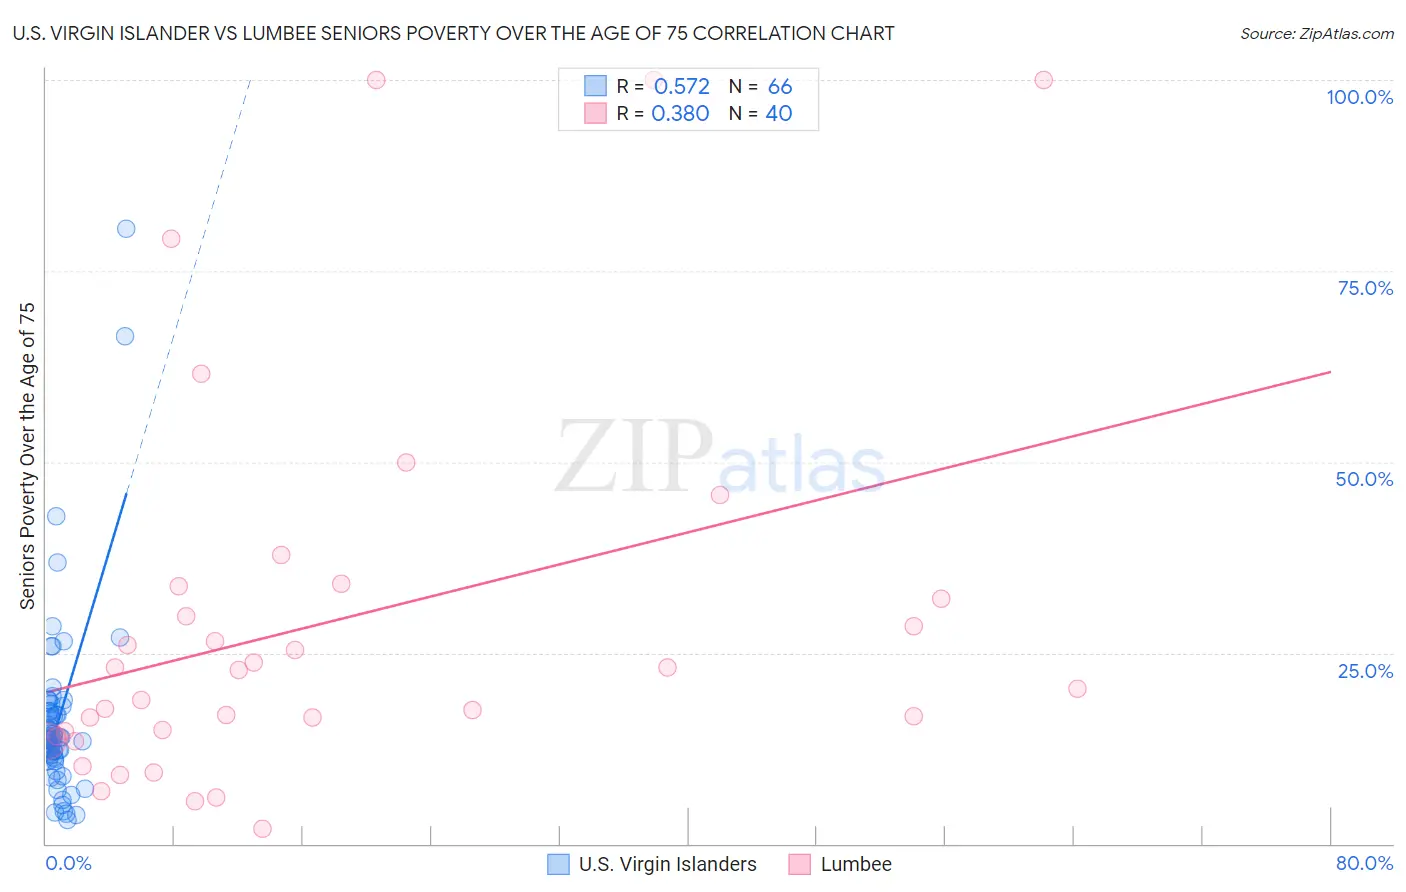
U.S. Virgin Islander vs Lumbee Seniors Poverty Over the Age of 75 Correlation Chart
The statistical analysis conducted on geographies consisting of 87,346,721 people shows a substantial positive correlation between the proportion of U.S. Virgin Islanders and poverty level among seniors over the age of 75 in the United States with a correlation coefficient (R) of 0.572 and weighted average of 15.4%. Similarly, the statistical analysis conducted on geographies consisting of 91,707,280 people shows a mild positive correlation between the proportion of Lumbee and poverty level among seniors over the age of 75 in the United States with a correlation coefficient (R) of 0.380 and weighted average of 19.7%, a difference of 28.4%.
Seniors Poverty Over the Age of 75 Correlation Summary
| Measurement | U.S. Virgin Islander | Lumbee |
| Minimum | 3.0% | 2.0% |
| Maximum | 80.5% | 100.0% |
| Range | 77.5% | 98.0% |
| Mean | 16.3% | 29.1% |
| Median | 13.8% | 21.5% |
| Interquartile 25% (IQ1) | 11.2% | 14.4% |
| Interquartile 75% (IQ3) | 17.3% | 32.9% |
| Interquartile Range (IQR) | 6.1% | 18.5% |
| Standard Deviation (Sample) | 12.6% | 25.5% |
| Standard Deviation (Population) | 12.5% | 25.2% |
Similar Demographics by Seniors Poverty Over the Age of 75
Demographics Similar to U.S. Virgin Islanders by Seniors Poverty Over the Age of 75
In terms of seniors poverty over the age of 75, the demographic groups most similar to U.S. Virgin Islanders are Yuman (15.4%, a difference of 0.18%), Immigrants from Jamaica (15.3%, a difference of 0.19%), Honduran (15.4%, a difference of 0.46%), Apache (15.3%, a difference of 0.64%), and Native/Alaskan (15.5%, a difference of 0.80%).
| Demographics | Rating | Rank | Seniors Poverty Over the Age of 75 |
| Jamaicans | 0.0 /100 | #288 | Tragic 15.1% |
| Immigrants | Belize | 0.0 /100 | #289 | Tragic 15.2% |
| Immigrants | Azores | 0.0 /100 | #290 | Tragic 15.2% |
| Paiute | 0.0 /100 | #291 | Tragic 15.2% |
| Colville | 0.0 /100 | #292 | Tragic 15.2% |
| Apache | 0.0 /100 | #293 | Tragic 15.3% |
| Immigrants | Jamaica | 0.0 /100 | #294 | Tragic 15.3% |
| U.S. Virgin Islanders | 0.0 /100 | #295 | Tragic 15.4% |
| Yuman | 0.0 /100 | #296 | Tragic 15.4% |
| Hondurans | 0.0 /100 | #297 | Tragic 15.4% |
| Natives/Alaskans | 0.0 /100 | #298 | Tragic 15.5% |
| Spanish American Indians | 0.0 /100 | #299 | Tragic 15.5% |
| Bahamians | 0.0 /100 | #300 | Tragic 15.5% |
| Immigrants | Latin America | 0.0 /100 | #301 | Tragic 15.6% |
| West Indians | 0.0 /100 | #302 | Tragic 15.7% |
Demographics Similar to Lumbee by Seniors Poverty Over the Age of 75
In terms of seniors poverty over the age of 75, the demographic groups most similar to Lumbee are Dominican (19.6%, a difference of 0.66%), Immigrants from Cuba (19.9%, a difference of 0.79%), Immigrants from Dominican Republic (20.1%, a difference of 1.6%), Navajo (19.4%, a difference of 1.9%), and Tohono O'odham (19.1%, a difference of 3.2%).
| Demographics | Rating | Rank | Seniors Poverty Over the Age of 75 |
| Immigrants | Nicaragua | 0.0 /100 | #333 | Tragic 17.6% |
| Immigrants | Grenada | 0.0 /100 | #334 | Tragic 17.8% |
| Cubans | 0.0 /100 | #335 | Tragic 18.0% |
| Immigrants | Caribbean | 0.0 /100 | #336 | Tragic 18.2% |
| Yakama | 0.0 /100 | #337 | Tragic 18.3% |
| Immigrants | Cabo Verde | 0.0 /100 | #338 | Tragic 18.5% |
| Hopi | 0.0 /100 | #339 | Tragic 18.9% |
| Tohono O'odham | 0.0 /100 | #340 | Tragic 19.1% |
| Navajo | 0.0 /100 | #341 | Tragic 19.4% |
| Dominicans | 0.0 /100 | #342 | Tragic 19.6% |
| Lumbee | 0.0 /100 | #343 | Tragic 19.7% |
| Immigrants | Cuba | 0.0 /100 | #344 | Tragic 19.9% |
| Immigrants | Dominican Republic | 0.0 /100 | #345 | Tragic 20.1% |
| Puerto Ricans | 0.0 /100 | #346 | Tragic 23.2% |
| Pima | 0.0 /100 | #347 | Tragic 23.9% |