Tsimshian vs Nepalese Seniors Poverty Over the Age of 65
COMPARE
Tsimshian
Nepalese
Seniors Poverty Over the Age of 65
Seniors Poverty Over the Age of 65 Comparison
Tsimshian
Nepalese
10.8%
SENIORS POVERTY OVER THE AGE OF 65
64.5/ 100
METRIC RATING
163rd/ 347
METRIC RANK
11.5%
SENIORS POVERTY OVER THE AGE OF 65
8.9/ 100
METRIC RATING
213th/ 347
METRIC RANK
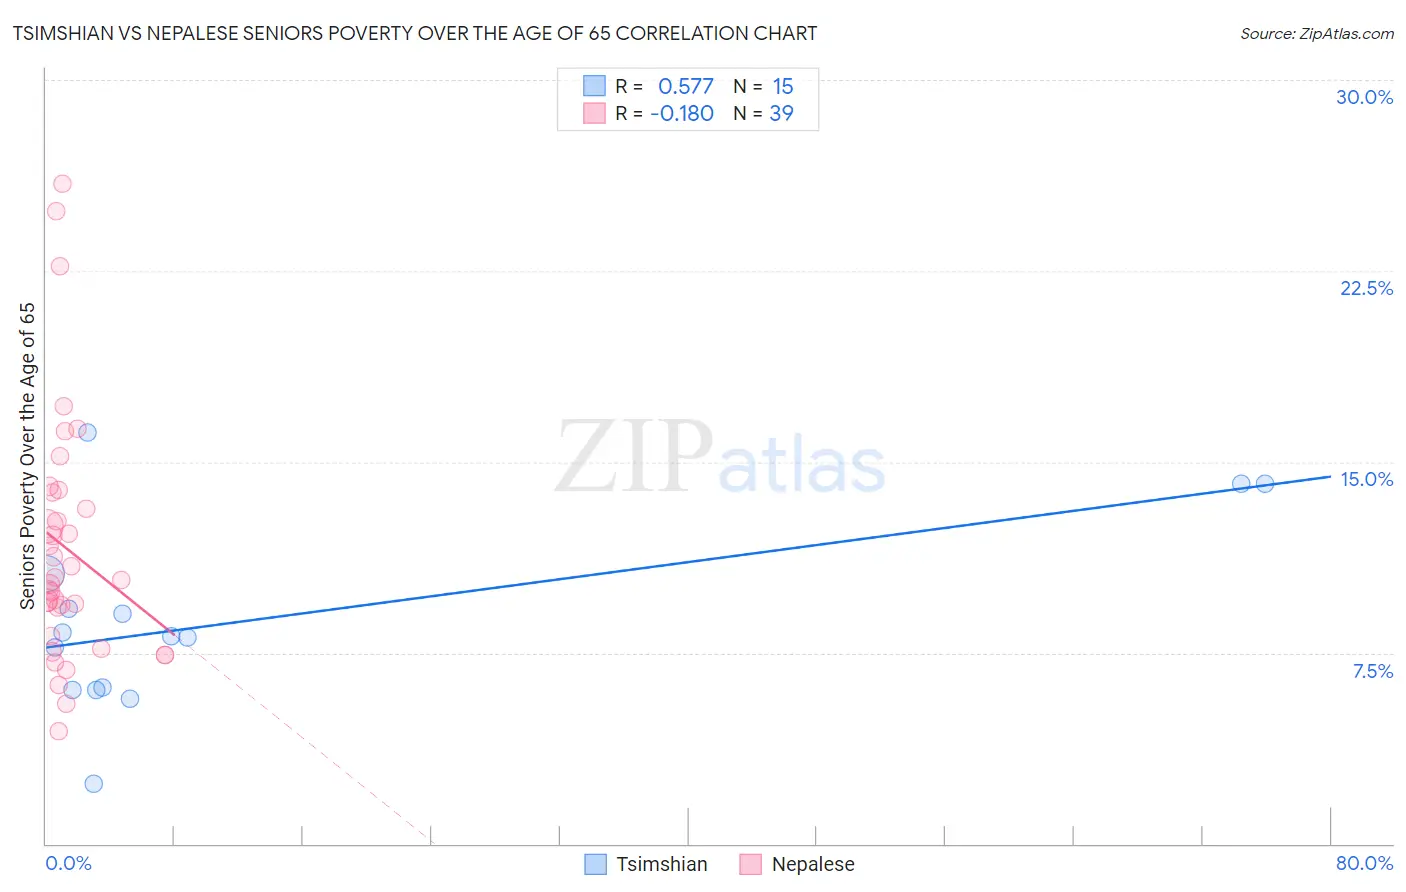
Tsimshian vs Nepalese Seniors Poverty Over the Age of 65 Correlation Chart
The statistical analysis conducted on geographies consisting of 15,615,288 people shows a substantial positive correlation between the proportion of Tsimshian and poverty level among seniors over the age of 65 in the United States with a correlation coefficient (R) of 0.577 and weighted average of 10.8%. Similarly, the statistical analysis conducted on geographies consisting of 24,494,934 people shows a poor negative correlation between the proportion of Nepalese and poverty level among seniors over the age of 65 in the United States with a correlation coefficient (R) of -0.180 and weighted average of 11.5%, a difference of 6.6%.
Seniors Poverty Over the Age of 65 Correlation Summary
| Measurement | Tsimshian | Nepalese |
| Minimum | 2.3% | 4.4% |
| Maximum | 16.2% | 25.9% |
| Range | 13.8% | 21.5% |
| Mean | 8.8% | 11.6% |
| Median | 8.1% | 10.3% |
| Interquartile 25% (IQ1) | 6.1% | 8.2% |
| Interquartile 75% (IQ3) | 10.6% | 13.8% |
| Interquartile Range (IQR) | 4.5% | 5.6% |
| Standard Deviation (Sample) | 3.7% | 4.8% |
| Standard Deviation (Population) | 3.6% | 4.8% |
Similar Demographics by Seniors Poverty Over the Age of 65
Demographics Similar to Tsimshian by Seniors Poverty Over the Age of 65
In terms of seniors poverty over the age of 65, the demographic groups most similar to Tsimshian are Immigrants from Indonesia (10.8%, a difference of 0.030%), Arab (10.8%, a difference of 0.070%), Potawatomi (10.8%, a difference of 0.19%), Immigrants from South Eastern Asia (10.8%, a difference of 0.23%), and Malaysian (10.8%, a difference of 0.24%).
| Demographics | Rating | Rank | Seniors Poverty Over the Age of 65 |
| Ethiopians | 72.9 /100 | #156 | Good 10.7% |
| Immigrants | Ethiopia | 72.9 /100 | #157 | Good 10.7% |
| Immigrants | Sierra Leone | 71.7 /100 | #158 | Good 10.7% |
| Immigrants | Micronesia | 70.8 /100 | #159 | Good 10.7% |
| Sudanese | 68.2 /100 | #160 | Good 10.7% |
| Arabs | 65.2 /100 | #161 | Good 10.8% |
| Immigrants | Indonesia | 64.8 /100 | #162 | Good 10.8% |
| Tsimshian | 64.5 /100 | #163 | Good 10.8% |
| Potawatomi | 62.6 /100 | #164 | Good 10.8% |
| Immigrants | South Eastern Asia | 62.1 /100 | #165 | Good 10.8% |
| Malaysians | 62.0 /100 | #166 | Good 10.8% |
| Alaska Natives | 60.3 /100 | #167 | Good 10.8% |
| Mongolians | 58.0 /100 | #168 | Average 10.9% |
| Sri Lankans | 56.8 /100 | #169 | Average 10.9% |
| Immigrants | Eastern Europe | 55.8 /100 | #170 | Average 10.9% |
Demographics Similar to Nepalese by Seniors Poverty Over the Age of 65
In terms of seniors poverty over the age of 65, the demographic groups most similar to Nepalese are Immigrants from Russia (11.5%, a difference of 0.020%), French American Indian (11.5%, a difference of 0.060%), Immigrants from China (11.5%, a difference of 0.16%), Indonesian (11.5%, a difference of 0.36%), and Ugandan (11.4%, a difference of 0.55%).
| Demographics | Rating | Rank | Seniors Poverty Over the Age of 65 |
| Choctaw | 14.5 /100 | #206 | Poor 11.4% |
| Immigrants | Western Asia | 13.6 /100 | #207 | Poor 11.4% |
| South American Indians | 11.7 /100 | #208 | Poor 11.4% |
| Paraguayans | 11.3 /100 | #209 | Poor 11.4% |
| Ugandans | 11.2 /100 | #210 | Poor 11.4% |
| Indonesians | 10.4 /100 | #211 | Poor 11.5% |
| Immigrants | China | 9.5 /100 | #212 | Tragic 11.5% |
| Nepalese | 8.9 /100 | #213 | Tragic 11.5% |
| Immigrants | Russia | 8.8 /100 | #214 | Tragic 11.5% |
| French American Indians | 8.7 /100 | #215 | Tragic 11.5% |
| Immigrants | Morocco | 6.8 /100 | #216 | Tragic 11.6% |
| Immigrants | Africa | 6.4 /100 | #217 | Tragic 11.6% |
| Immigrants | Ukraine | 5.7 /100 | #218 | Tragic 11.6% |
| Arapaho | 5.2 /100 | #219 | Tragic 11.6% |
| Peruvians | 4.2 /100 | #220 | Tragic 11.7% |