Immigrants from Lithuania vs Nepalese Seniors Poverty Over the Age of 65
COMPARE
Immigrants from Lithuania
Nepalese
Seniors Poverty Over the Age of 65
Seniors Poverty Over the Age of 65 Comparison
Immigrants from Lithuania
Nepalese
9.7%
SENIORS POVERTY OVER THE AGE OF 65
99.4/ 100
METRIC RATING
49th/ 347
METRIC RANK
11.5%
SENIORS POVERTY OVER THE AGE OF 65
8.9/ 100
METRIC RATING
213th/ 347
METRIC RANK
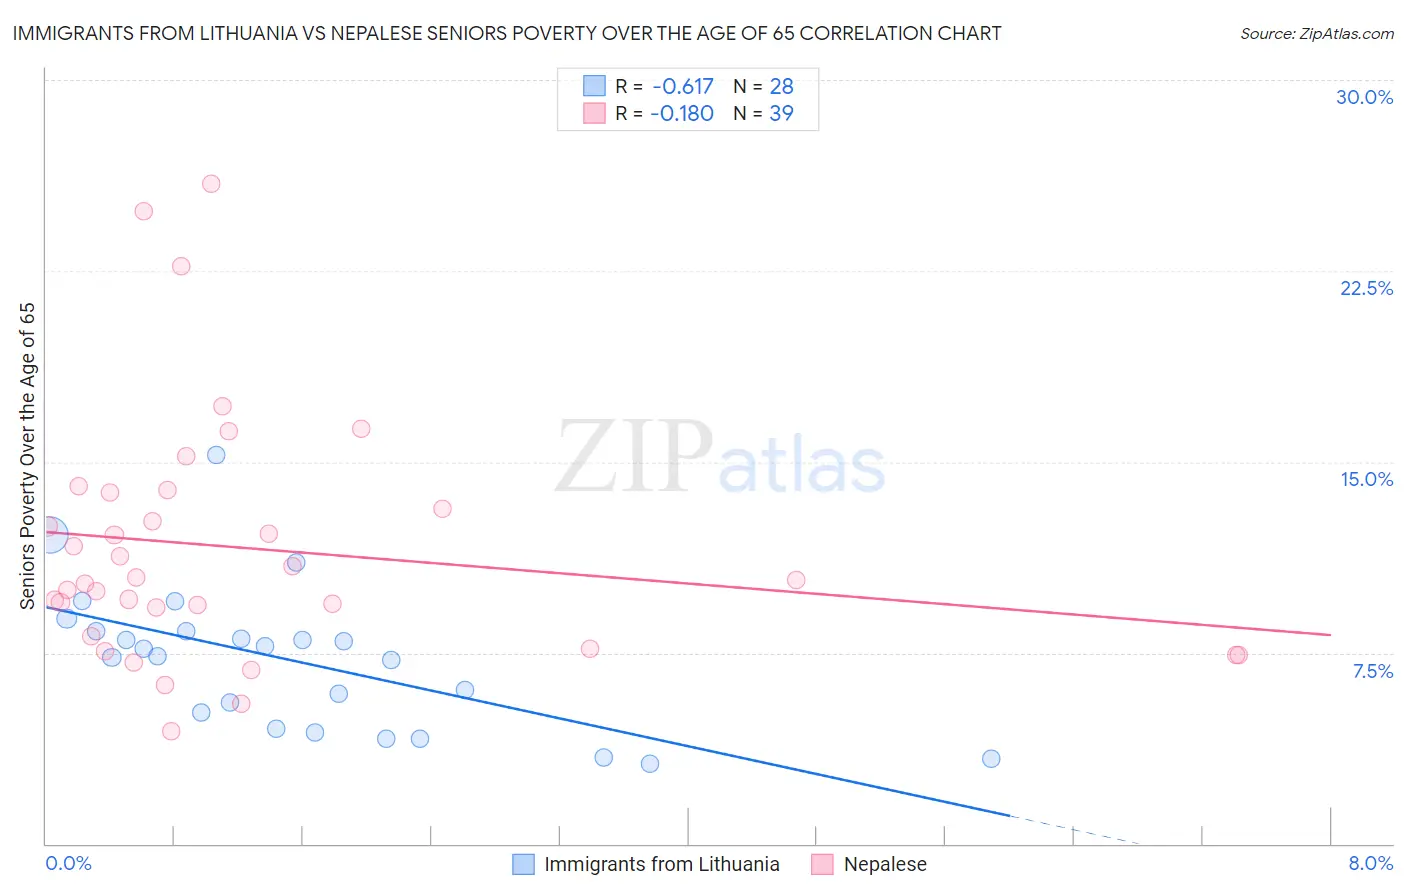
Immigrants from Lithuania vs Nepalese Seniors Poverty Over the Age of 65 Correlation Chart
The statistical analysis conducted on geographies consisting of 117,675,317 people shows a significant negative correlation between the proportion of Immigrants from Lithuania and poverty level among seniors over the age of 65 in the United States with a correlation coefficient (R) of -0.617 and weighted average of 9.7%. Similarly, the statistical analysis conducted on geographies consisting of 24,494,934 people shows a poor negative correlation between the proportion of Nepalese and poverty level among seniors over the age of 65 in the United States with a correlation coefficient (R) of -0.180 and weighted average of 11.5%, a difference of 18.8%.
Seniors Poverty Over the Age of 65 Correlation Summary
| Measurement | Immigrants from Lithuania | Nepalese |
| Minimum | 3.1% | 4.4% |
| Maximum | 15.3% | 25.9% |
| Range | 12.2% | 21.5% |
| Mean | 7.2% | 11.6% |
| Median | 7.5% | 10.3% |
| Interquartile 25% (IQ1) | 4.8% | 8.2% |
| Interquartile 75% (IQ3) | 8.3% | 13.8% |
| Interquartile Range (IQR) | 3.5% | 5.6% |
| Standard Deviation (Sample) | 2.8% | 4.8% |
| Standard Deviation (Population) | 2.8% | 4.8% |
Similar Demographics by Seniors Poverty Over the Age of 65
Demographics Similar to Immigrants from Lithuania by Seniors Poverty Over the Age of 65
In terms of seniors poverty over the age of 65, the demographic groups most similar to Immigrants from Lithuania are French (9.7%, a difference of 0.060%), Immigrants from South Central Asia (9.7%, a difference of 0.17%), Immigrants from Taiwan (9.7%, a difference of 0.18%), Hungarian (9.7%, a difference of 0.22%), and Estonian (9.6%, a difference of 0.31%).
| Demographics | Rating | Rank | Seniors Poverty Over the Age of 65 |
| Zimbabweans | 99.6 /100 | #42 | Exceptional 9.6% |
| Eastern Europeans | 99.6 /100 | #43 | Exceptional 9.6% |
| Austrians | 99.5 /100 | #44 | Exceptional 9.6% |
| Estonians | 99.5 /100 | #45 | Exceptional 9.6% |
| Immigrants | Taiwan | 99.5 /100 | #46 | Exceptional 9.7% |
| Immigrants | South Central Asia | 99.5 /100 | #47 | Exceptional 9.7% |
| French | 99.5 /100 | #48 | Exceptional 9.7% |
| Immigrants | Lithuania | 99.4 /100 | #49 | Exceptional 9.7% |
| Hungarians | 99.4 /100 | #50 | Exceptional 9.7% |
| Carpatho Rusyns | 99.3 /100 | #51 | Exceptional 9.7% |
| Filipinos | 99.3 /100 | #52 | Exceptional 9.7% |
| Slavs | 99.2 /100 | #53 | Exceptional 9.8% |
| Immigrants | Northern Europe | 99.2 /100 | #54 | Exceptional 9.8% |
| Afghans | 99.2 /100 | #55 | Exceptional 9.8% |
| Immigrants | England | 99.1 /100 | #56 | Exceptional 9.8% |
Demographics Similar to Nepalese by Seniors Poverty Over the Age of 65
In terms of seniors poverty over the age of 65, the demographic groups most similar to Nepalese are Immigrants from Russia (11.5%, a difference of 0.020%), French American Indian (11.5%, a difference of 0.060%), Immigrants from China (11.5%, a difference of 0.16%), Indonesian (11.5%, a difference of 0.36%), and Ugandan (11.4%, a difference of 0.55%).
| Demographics | Rating | Rank | Seniors Poverty Over the Age of 65 |
| Choctaw | 14.5 /100 | #206 | Poor 11.4% |
| Immigrants | Western Asia | 13.6 /100 | #207 | Poor 11.4% |
| South American Indians | 11.7 /100 | #208 | Poor 11.4% |
| Paraguayans | 11.3 /100 | #209 | Poor 11.4% |
| Ugandans | 11.2 /100 | #210 | Poor 11.4% |
| Indonesians | 10.4 /100 | #211 | Poor 11.5% |
| Immigrants | China | 9.5 /100 | #212 | Tragic 11.5% |
| Nepalese | 8.9 /100 | #213 | Tragic 11.5% |
| Immigrants | Russia | 8.8 /100 | #214 | Tragic 11.5% |
| French American Indians | 8.7 /100 | #215 | Tragic 11.5% |
| Immigrants | Morocco | 6.8 /100 | #216 | Tragic 11.6% |
| Immigrants | Africa | 6.4 /100 | #217 | Tragic 11.6% |
| Immigrants | Ukraine | 5.7 /100 | #218 | Tragic 11.6% |
| Arapaho | 5.2 /100 | #219 | Tragic 11.6% |
| Peruvians | 4.2 /100 | #220 | Tragic 11.7% |