Immigrants from Ecuador vs Immigrants from Jamaica Single Father Poverty
COMPARE
Immigrants from Ecuador
Immigrants from Jamaica
Single Father Poverty
Single Father Poverty Comparison
Immigrants from Ecuador
Immigrants from Jamaica
16.3%
SINGLE FATHER POVERTY
49.7/ 100
METRIC RATING
175th/ 347
METRIC RANK
17.2%
SINGLE FATHER POVERTY
0.7/ 100
METRIC RATING
259th/ 347
METRIC RANK
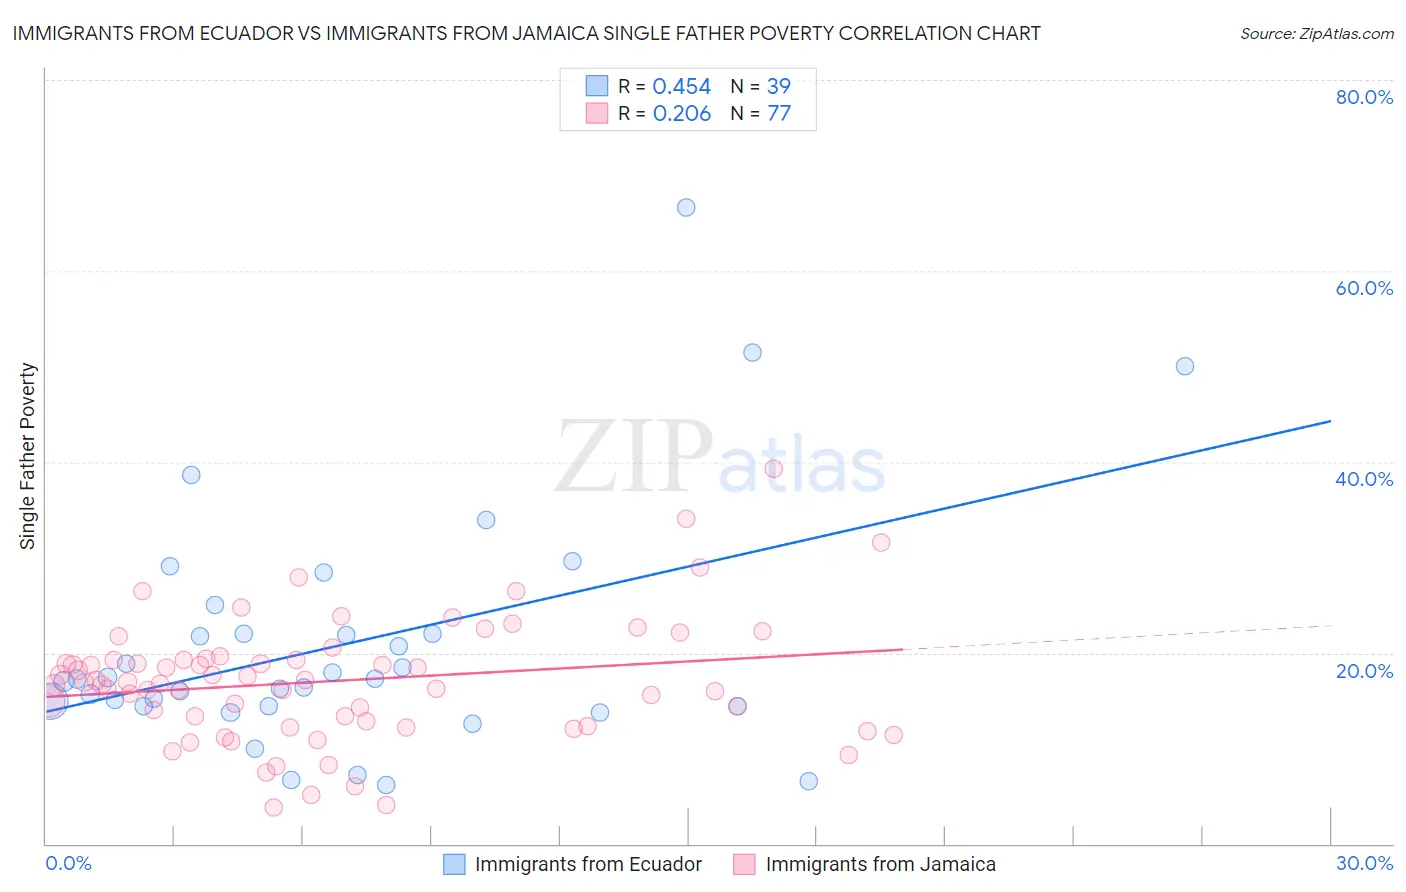
Immigrants from Ecuador vs Immigrants from Jamaica Single Father Poverty Correlation Chart
The statistical analysis conducted on geographies consisting of 223,687,874 people shows a moderate positive correlation between the proportion of Immigrants from Ecuador and poverty level among single fathers in the United States with a correlation coefficient (R) of 0.454 and weighted average of 16.3%. Similarly, the statistical analysis conducted on geographies consisting of 246,936,090 people shows a weak positive correlation between the proportion of Immigrants from Jamaica and poverty level among single fathers in the United States with a correlation coefficient (R) of 0.206 and weighted average of 17.2%, a difference of 5.5%.
Single Father Poverty Correlation Summary
| Measurement | Immigrants from Ecuador | Immigrants from Jamaica |
| Minimum | 6.2% | 3.8% |
| Maximum | 66.7% | 39.3% |
| Range | 60.5% | 35.5% |
| Mean | 20.9% | 17.1% |
| Median | 17.3% | 16.9% |
| Interquartile 25% (IQ1) | 14.3% | 12.6% |
| Interquartile 75% (IQ3) | 22.0% | 19.3% |
| Interquartile Range (IQR) | 7.7% | 6.8% |
| Standard Deviation (Sample) | 12.7% | 6.5% |
| Standard Deviation (Population) | 12.5% | 6.4% |
Similar Demographics by Single Father Poverty
Demographics Similar to Immigrants from Ecuador by Single Father Poverty
In terms of single father poverty, the demographic groups most similar to Immigrants from Ecuador are Immigrants from Sierra Leone (16.3%, a difference of 0.020%), Immigrants from St. Vincent and the Grenadines (16.3%, a difference of 0.020%), Swedish (16.3%, a difference of 0.020%), Immigrants from Morocco (16.3%, a difference of 0.050%), and Vietnamese (16.3%, a difference of 0.070%).
| Demographics | Rating | Rank | Single Father Poverty |
| Costa Ricans | 53.6 /100 | #168 | Average 16.3% |
| Northern Europeans | 52.8 /100 | #169 | Average 16.3% |
| Scandinavians | 52.3 /100 | #170 | Average 16.3% |
| Immigrants | Morocco | 50.7 /100 | #171 | Average 16.3% |
| Immigrants | Sierra Leone | 50.1 /100 | #172 | Average 16.3% |
| Immigrants | St. Vincent and the Grenadines | 50.0 /100 | #173 | Average 16.3% |
| Swedes | 50.0 /100 | #174 | Average 16.3% |
| Immigrants | Ecuador | 49.7 /100 | #175 | Average 16.3% |
| Vietnamese | 48.0 /100 | #176 | Average 16.3% |
| Immigrants | South Africa | 44.2 /100 | #177 | Average 16.3% |
| Immigrants | Cuba | 41.6 /100 | #178 | Average 16.4% |
| Serbians | 40.9 /100 | #179 | Average 16.4% |
| Immigrants | Latin America | 37.2 /100 | #180 | Fair 16.4% |
| Immigrants | Western Africa | 36.0 /100 | #181 | Fair 16.4% |
| Immigrants | Italy | 35.7 /100 | #182 | Fair 16.4% |
Demographics Similar to Immigrants from Jamaica by Single Father Poverty
In terms of single father poverty, the demographic groups most similar to Immigrants from Jamaica are Albanian (17.2%, a difference of 0.040%), Immigrants from Albania (17.2%, a difference of 0.050%), Immigrants from Haiti (17.2%, a difference of 0.13%), Sierra Leonean (17.2%, a difference of 0.14%), and Spaniard (17.2%, a difference of 0.15%).
| Demographics | Rating | Rank | Single Father Poverty |
| Croatians | 1.0 /100 | #252 | Tragic 17.1% |
| Cree | 1.0 /100 | #253 | Tragic 17.1% |
| Immigrants | Honduras | 0.9 /100 | #254 | Tragic 17.1% |
| Sierra Leoneans | 0.8 /100 | #255 | Tragic 17.2% |
| Immigrants | Haiti | 0.8 /100 | #256 | Tragic 17.2% |
| Immigrants | Albania | 0.7 /100 | #257 | Tragic 17.2% |
| Albanians | 0.7 /100 | #258 | Tragic 17.2% |
| Immigrants | Jamaica | 0.7 /100 | #259 | Tragic 17.2% |
| Spaniards | 0.6 /100 | #260 | Tragic 17.2% |
| Swiss | 0.5 /100 | #261 | Tragic 17.3% |
| Immigrants | Zaire | 0.4 /100 | #262 | Tragic 17.3% |
| Lithuanians | 0.4 /100 | #263 | Tragic 17.3% |
| Slovenes | 0.3 /100 | #264 | Tragic 17.3% |
| Poles | 0.3 /100 | #265 | Tragic 17.3% |
| Jamaicans | 0.3 /100 | #266 | Tragic 17.3% |