Trinidadian and Tobagonian vs Immigrants from England Receiving Food Stamps
COMPARE
Trinidadian and Tobagonian
Immigrants from England
Receiving Food Stamps
Receiving Food Stamps Comparison
Trinidadians and Tobagonians
Immigrants from England
16.0%
RECEIVING FOOD STAMPS
0.0/ 100
METRIC RATING
301st/ 347
METRIC RANK
10.0%
RECEIVING FOOD STAMPS
98.6/ 100
METRIC RATING
81st/ 347
METRIC RANK
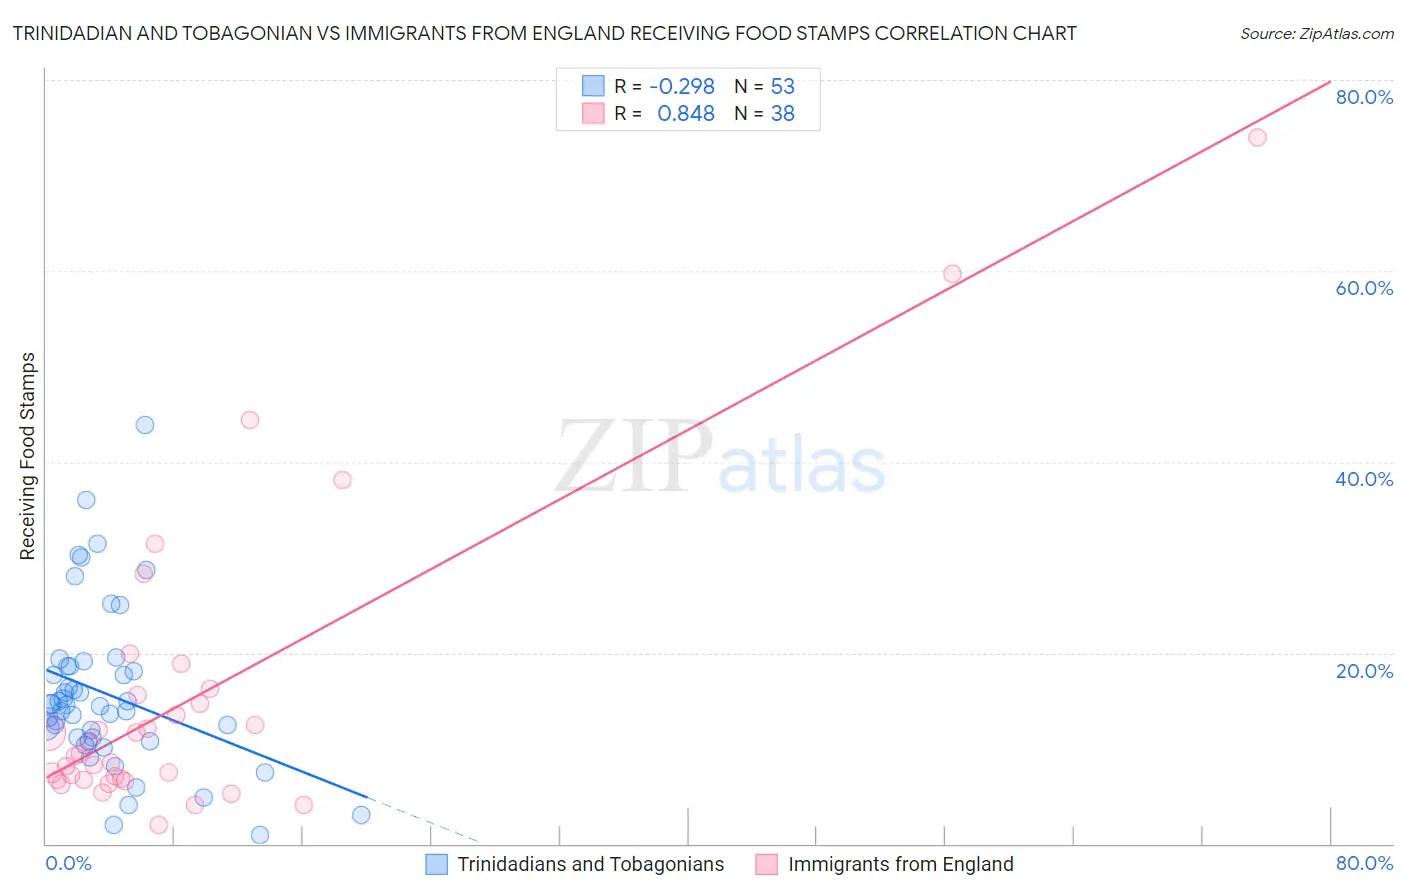
Trinidadian and Tobagonian vs Immigrants from England Receiving Food Stamps Correlation Chart
The statistical analysis conducted on geographies consisting of 219,495,740 people shows a weak negative correlation between the proportion of Trinidadians and Tobagonians and percentage of population receiving government assistance and/or food stamps in the United States with a correlation coefficient (R) of -0.298 and weighted average of 16.0%. Similarly, the statistical analysis conducted on geographies consisting of 390,689,765 people shows a very strong positive correlation between the proportion of Immigrants from England and percentage of population receiving government assistance and/or food stamps in the United States with a correlation coefficient (R) of 0.848 and weighted average of 10.0%, a difference of 60.0%.
Receiving Food Stamps Correlation Summary
| Measurement | Trinidadian and Tobagonian | Immigrants from England |
| Minimum | 0.90% | 2.0% |
| Maximum | 43.8% | 74.0% |
| Range | 42.9% | 72.0% |
| Mean | 15.7% | 15.2% |
| Median | 14.5% | 9.3% |
| Interquartile 25% (IQ1) | 10.9% | 6.7% |
| Interquartile 75% (IQ3) | 18.6% | 15.5% |
| Interquartile Range (IQR) | 7.7% | 8.9% |
| Standard Deviation (Sample) | 8.5% | 15.5% |
| Standard Deviation (Population) | 8.4% | 15.3% |
Similar Demographics by Receiving Food Stamps
Demographics Similar to Trinidadians and Tobagonians by Receiving Food Stamps
In terms of receiving food stamps, the demographic groups most similar to Trinidadians and Tobagonians are Immigrants from Bangladesh (15.9%, a difference of 0.45%), Hispanic or Latino (15.8%, a difference of 0.89%), Immigrants from West Indies (16.1%, a difference of 0.94%), Nicaraguan (16.1%, a difference of 1.0%), and Immigrants from Trinidad and Tobago (15.8%, a difference of 1.2%).
| Demographics | Rating | Rank | Receiving Food Stamps |
| Immigrants | Latin America | 0.0 /100 | #294 | Tragic 15.7% |
| Immigrants | Honduras | 0.0 /100 | #295 | Tragic 15.7% |
| Tsimshian | 0.0 /100 | #296 | Tragic 15.7% |
| Immigrants | Bahamas | 0.0 /100 | #297 | Tragic 15.8% |
| Immigrants | Trinidad and Tobago | 0.0 /100 | #298 | Tragic 15.8% |
| Hispanics or Latinos | 0.0 /100 | #299 | Tragic 15.8% |
| Immigrants | Bangladesh | 0.0 /100 | #300 | Tragic 15.9% |
| Trinidadians and Tobagonians | 0.0 /100 | #301 | Tragic 16.0% |
| Immigrants | West Indies | 0.0 /100 | #302 | Tragic 16.1% |
| Nicaraguans | 0.0 /100 | #303 | Tragic 16.1% |
| West Indians | 0.0 /100 | #304 | Tragic 16.3% |
| Immigrants | Azores | 0.0 /100 | #305 | Tragic 16.4% |
| Jamaicans | 0.0 /100 | #306 | Tragic 16.4% |
| Houma | 0.0 /100 | #307 | Tragic 16.5% |
| Barbadians | 0.0 /100 | #308 | Tragic 16.5% |
Demographics Similar to Immigrants from England by Receiving Food Stamps
In terms of receiving food stamps, the demographic groups most similar to Immigrants from England are Austrian (10.0%, a difference of 0.13%), Dutch (10.0%, a difference of 0.13%), Polish (10.0%, a difference of 0.14%), Immigrants from Israel (10.0%, a difference of 0.20%), and Laotian (10.0%, a difference of 0.22%).
| Demographics | Rating | Rank | Receiving Food Stamps |
| New Zealanders | 98.8 /100 | #74 | Exceptional 9.9% |
| Immigrants | Zimbabwe | 98.7 /100 | #75 | Exceptional 9.9% |
| Immigrants | Croatia | 98.7 /100 | #76 | Exceptional 10.0% |
| Immigrants | North Macedonia | 98.7 /100 | #77 | Exceptional 10.0% |
| South Africans | 98.7 /100 | #78 | Exceptional 10.0% |
| Laotians | 98.7 /100 | #79 | Exceptional 10.0% |
| Poles | 98.6 /100 | #80 | Exceptional 10.0% |
| Immigrants | England | 98.6 /100 | #81 | Exceptional 10.0% |
| Austrians | 98.6 /100 | #82 | Exceptional 10.0% |
| Dutch | 98.6 /100 | #83 | Exceptional 10.0% |
| Immigrants | Israel | 98.5 /100 | #84 | Exceptional 10.0% |
| Immigrants | Romania | 98.5 /100 | #85 | Exceptional 10.0% |
| Immigrants | Norway | 98.4 /100 | #86 | Exceptional 10.0% |
| Egyptians | 98.4 /100 | #87 | Exceptional 10.0% |
| Immigrants | Kuwait | 98.4 /100 | #88 | Exceptional 10.0% |