Tongan vs Osage Seniors Poverty Over the Age of 65
COMPARE
Tongan
Osage
Seniors Poverty Over the Age of 65
Seniors Poverty Over the Age of 65 Comparison
Tongans
Osage
9.3%
SENIORS POVERTY OVER THE AGE OF 65
99.9/ 100
METRIC RATING
28th/ 347
METRIC RANK
10.6%
SENIORS POVERTY OVER THE AGE OF 65
82.8/ 100
METRIC RATING
142nd/ 347
METRIC RANK
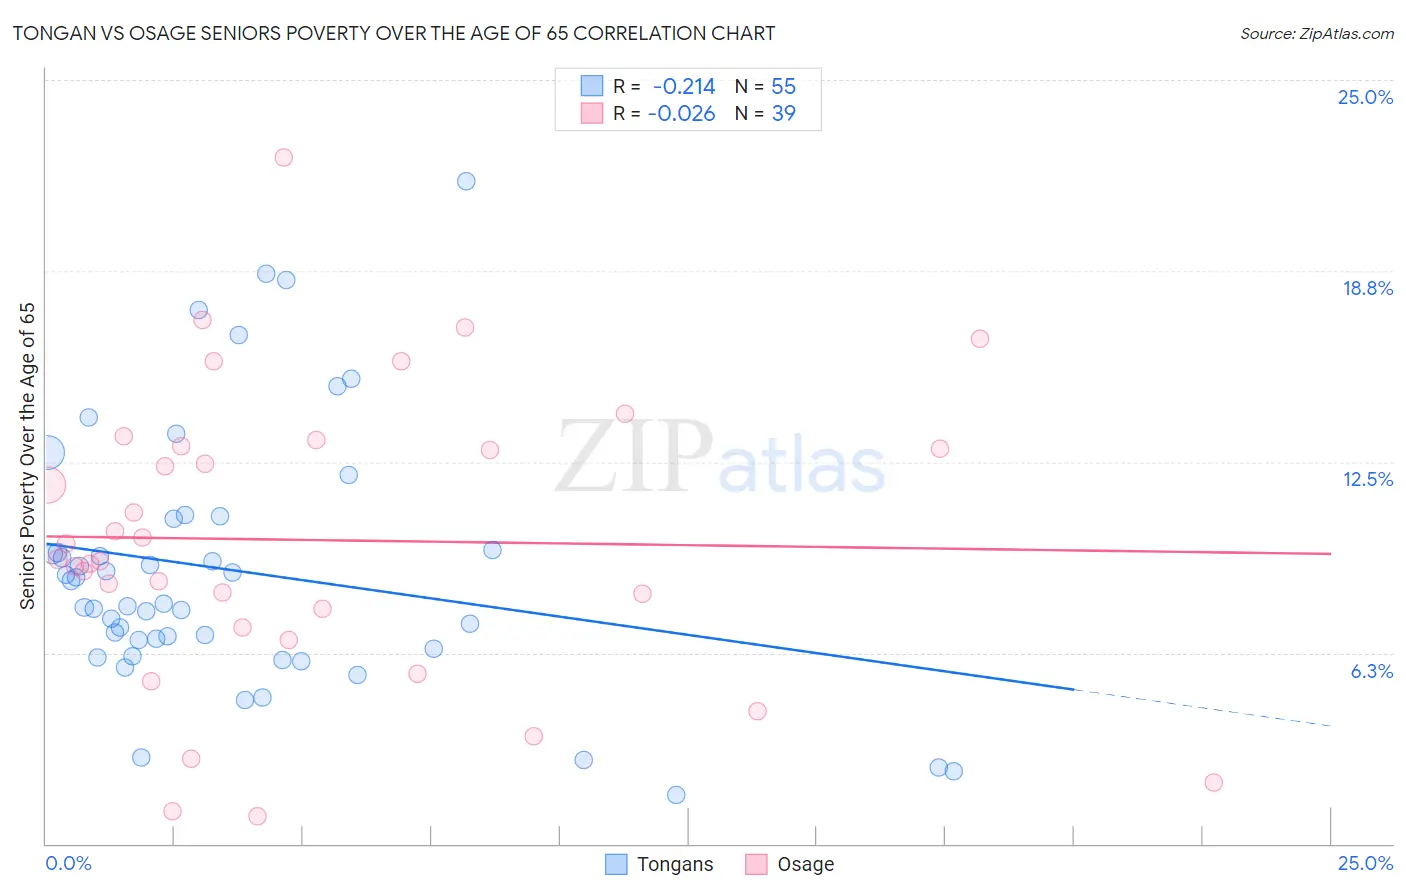
Tongan vs Osage Seniors Poverty Over the Age of 65 Correlation Chart
The statistical analysis conducted on geographies consisting of 102,677,061 people shows a weak negative correlation between the proportion of Tongans and poverty level among seniors over the age of 65 in the United States with a correlation coefficient (R) of -0.214 and weighted average of 9.3%. Similarly, the statistical analysis conducted on geographies consisting of 91,738,708 people shows no correlation between the proportion of Osage and poverty level among seniors over the age of 65 in the United States with a correlation coefficient (R) of -0.026 and weighted average of 10.6%, a difference of 13.3%.
Seniors Poverty Over the Age of 65 Correlation Summary
| Measurement | Tongan | Osage |
| Minimum | 1.6% | 0.89% |
| Maximum | 21.7% | 22.5% |
| Range | 20.1% | 21.6% |
| Mean | 8.9% | 9.9% |
| Median | 7.9% | 9.3% |
| Interquartile 25% (IQ1) | 6.4% | 7.1% |
| Interquartile 75% (IQ3) | 10.6% | 13.0% |
| Interquartile Range (IQR) | 4.3% | 5.9% |
| Standard Deviation (Sample) | 4.3% | 4.8% |
| Standard Deviation (Population) | 4.2% | 4.7% |
Similar Demographics by Seniors Poverty Over the Age of 65
Demographics Similar to Tongans by Seniors Poverty Over the Age of 65
In terms of seniors poverty over the age of 65, the demographic groups most similar to Tongans are Italian (9.3%, a difference of 0.20%), Immigrants from Scotland (9.3%, a difference of 0.27%), Irish (9.3%, a difference of 0.30%), Bhutanese (9.3%, a difference of 0.32%), and Menominee (9.4%, a difference of 0.48%).
| Demographics | Rating | Rank | Seniors Poverty Over the Age of 65 |
| Luxembourgers | 99.9 /100 | #21 | Exceptional 9.2% |
| Slovenes | 99.9 /100 | #22 | Exceptional 9.3% |
| Welsh | 99.9 /100 | #23 | Exceptional 9.3% |
| Bulgarians | 99.9 /100 | #24 | Exceptional 9.3% |
| Irish | 99.9 /100 | #25 | Exceptional 9.3% |
| Immigrants | Scotland | 99.9 /100 | #26 | Exceptional 9.3% |
| Italians | 99.9 /100 | #27 | Exceptional 9.3% |
| Tongans | 99.9 /100 | #28 | Exceptional 9.3% |
| Bhutanese | 99.9 /100 | #29 | Exceptional 9.3% |
| Menominee | 99.8 /100 | #30 | Exceptional 9.4% |
| Finns | 99.8 /100 | #31 | Exceptional 9.4% |
| Northern Europeans | 99.8 /100 | #32 | Exceptional 9.4% |
| Native Hawaiians | 99.8 /100 | #33 | Exceptional 9.4% |
| British | 99.8 /100 | #34 | Exceptional 9.4% |
| Latvians | 99.8 /100 | #35 | Exceptional 9.5% |
Demographics Similar to Osage by Seniors Poverty Over the Age of 65
In terms of seniors poverty over the age of 65, the demographic groups most similar to Osage are Immigrants from Europe (10.5%, a difference of 0.070%), Immigrants from Kenya (10.5%, a difference of 0.090%), Portuguese (10.5%, a difference of 0.22%), Immigrants from Latvia (10.5%, a difference of 0.32%), and Immigrants from Asia (10.6%, a difference of 0.32%).
| Demographics | Rating | Rank | Seniors Poverty Over the Age of 65 |
| Immigrants | Norway | 86.5 /100 | #135 | Excellent 10.5% |
| Immigrants | Serbia | 86.4 /100 | #136 | Excellent 10.5% |
| Immigrants | Australia | 85.1 /100 | #137 | Excellent 10.5% |
| Immigrants | Latvia | 84.7 /100 | #138 | Excellent 10.5% |
| Portuguese | 84.1 /100 | #139 | Excellent 10.5% |
| Immigrants | Kenya | 83.4 /100 | #140 | Excellent 10.5% |
| Immigrants | Europe | 83.3 /100 | #141 | Excellent 10.5% |
| Osage | 82.8 /100 | #142 | Excellent 10.6% |
| Immigrants | Asia | 80.8 /100 | #143 | Excellent 10.6% |
| Iraqis | 80.7 /100 | #144 | Excellent 10.6% |
| Laotians | 79.9 /100 | #145 | Good 10.6% |
| Alaskan Athabascans | 79.1 /100 | #146 | Good 10.6% |
| Immigrants | Greece | 79.0 /100 | #147 | Good 10.6% |
| Americans | 78.1 /100 | #148 | Good 10.6% |
| Immigrants | Cameroon | 78.1 /100 | #149 | Good 10.6% |