Tongan vs Korean In Labor Force | Age 16-19
COMPARE
Tongan
Korean
In Labor Force | Age 16-19
In Labor Force | Age 16-19 Comparison
Tongans
Koreans
41.2%
IN LABOR FORCE | AGE 16-19
100.0/ 100
METRIC RATING
43rd/ 347
METRIC RANK
35.7%
IN LABOR FORCE | AGE 16-19
13.3/ 100
METRIC RATING
208th/ 347
METRIC RANK
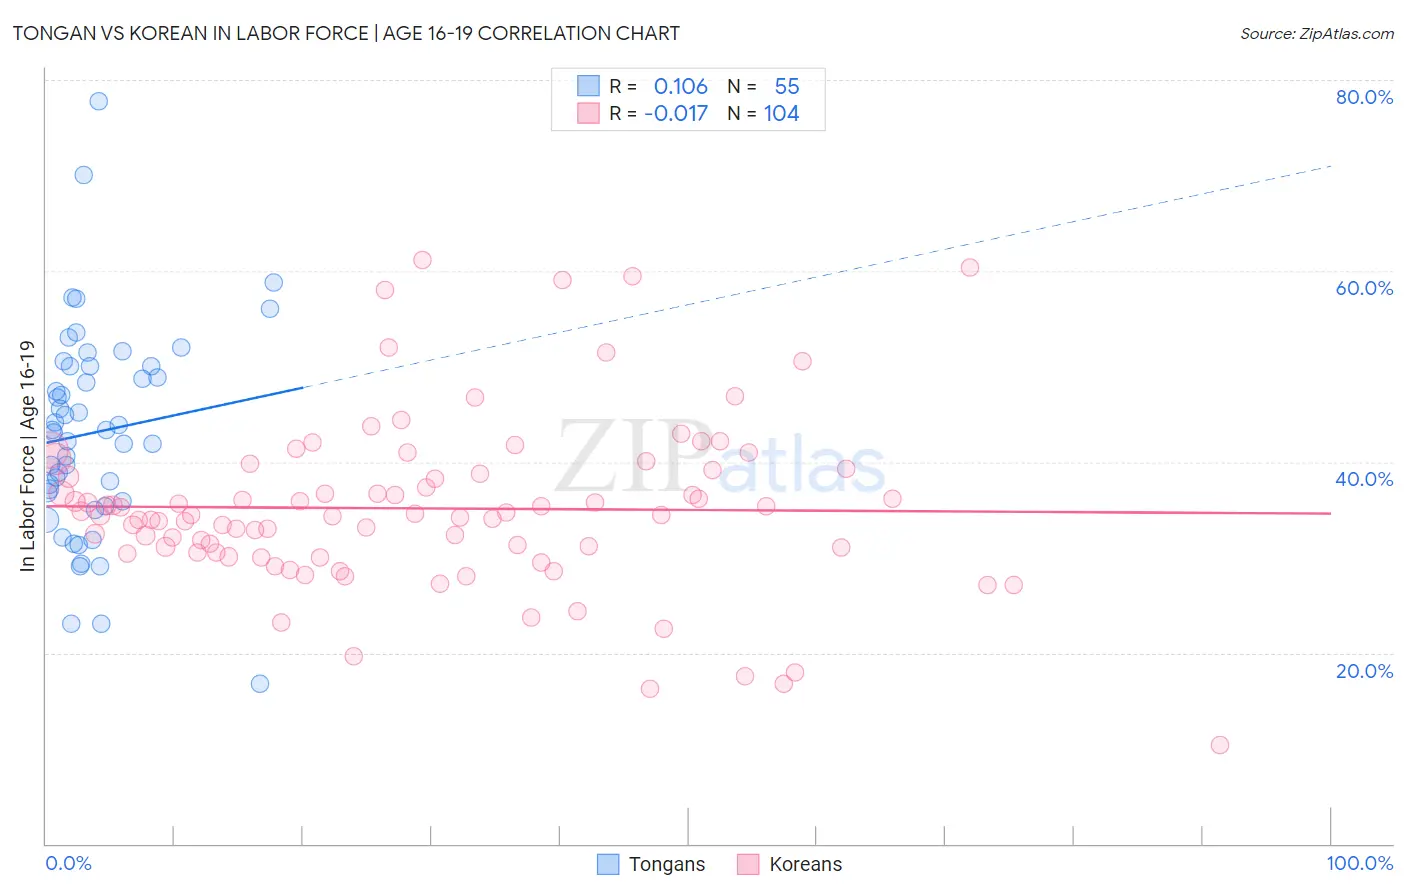
Tongan vs Korean In Labor Force | Age 16-19 Correlation Chart
The statistical analysis conducted on geographies consisting of 102,873,941 people shows a poor positive correlation between the proportion of Tongans and labor force participation rate among population between the ages 16 and 19 in the United States with a correlation coefficient (R) of 0.106 and weighted average of 41.2%. Similarly, the statistical analysis conducted on geographies consisting of 509,513,033 people shows no correlation between the proportion of Koreans and labor force participation rate among population between the ages 16 and 19 in the United States with a correlation coefficient (R) of -0.017 and weighted average of 35.7%, a difference of 15.3%.
In Labor Force | Age 16-19 Correlation Summary
| Measurement | Tongan | Korean |
| Minimum | 16.7% | 10.4% |
| Maximum | 77.7% | 61.1% |
| Range | 61.0% | 50.7% |
| Mean | 43.1% | 35.1% |
| Median | 43.3% | 34.4% |
| Interquartile 25% (IQ1) | 35.9% | 30.5% |
| Interquartile 75% (IQ3) | 50.0% | 39.0% |
| Interquartile Range (IQR) | 14.1% | 8.4% |
| Standard Deviation (Sample) | 11.1% | 9.0% |
| Standard Deviation (Population) | 11.0% | 8.9% |
Similar Demographics by In Labor Force | Age 16-19
Demographics Similar to Tongans by In Labor Force | Age 16-19
In terms of in labor force | age 16-19, the demographic groups most similar to Tongans are European (41.1%, a difference of 0.10%), Croatian (41.1%, a difference of 0.14%), White/Caucasian (41.3%, a difference of 0.30%), Celtic (41.3%, a difference of 0.31%), and Immigrants from Sudan (41.0%, a difference of 0.46%).
| Demographics | Rating | Rank | In Labor Force | Age 16-19 |
| Immigrants | Azores | 100.0 /100 | #36 | Exceptional 41.7% |
| Immigrants | Congo | 100.0 /100 | #37 | Exceptional 41.7% |
| Sioux | 100.0 /100 | #38 | Exceptional 41.5% |
| Scotch-Irish | 100.0 /100 | #39 | Exceptional 41.5% |
| Immigrants | Liberia | 100.0 /100 | #40 | Exceptional 41.5% |
| Celtics | 100.0 /100 | #41 | Exceptional 41.3% |
| Whites/Caucasians | 100.0 /100 | #42 | Exceptional 41.3% |
| Tongans | 100.0 /100 | #43 | Exceptional 41.2% |
| Europeans | 100.0 /100 | #44 | Exceptional 41.1% |
| Croatians | 100.0 /100 | #45 | Exceptional 41.1% |
| Immigrants | Sudan | 100.0 /100 | #46 | Exceptional 41.0% |
| Carpatho Rusyns | 100.0 /100 | #47 | Exceptional 40.8% |
| Icelanders | 100.0 /100 | #48 | Exceptional 40.8% |
| Cree | 100.0 /100 | #49 | Exceptional 40.8% |
| Indonesians | 100.0 /100 | #50 | Exceptional 40.7% |
Demographics Similar to Koreans by In Labor Force | Age 16-19
In terms of in labor force | age 16-19, the demographic groups most similar to Koreans are Moroccan (35.7%, a difference of 0.070%), Immigrants from Eastern Europe (35.8%, a difference of 0.12%), South American Indian (35.8%, a difference of 0.14%), Chilean (35.8%, a difference of 0.14%), and Immigrants from Albania (35.8%, a difference of 0.17%).
| Demographics | Rating | Rank | In Labor Force | Age 16-19 |
| Alsatians | 17.5 /100 | #201 | Poor 35.9% |
| Senegalese | 17.4 /100 | #202 | Poor 35.9% |
| Immigrants | Nigeria | 16.8 /100 | #203 | Poor 35.8% |
| Immigrants | Albania | 15.0 /100 | #204 | Poor 35.8% |
| South American Indians | 14.6 /100 | #205 | Poor 35.8% |
| Chileans | 14.6 /100 | #206 | Poor 35.8% |
| Immigrants | Eastern Europe | 14.5 /100 | #207 | Poor 35.8% |
| Koreans | 13.3 /100 | #208 | Poor 35.7% |
| Moroccans | 12.7 /100 | #209 | Poor 35.7% |
| Immigrants | Switzerland | 11.9 /100 | #210 | Poor 35.6% |
| Mexicans | 11.9 /100 | #211 | Poor 35.6% |
| Houma | 11.0 /100 | #212 | Poor 35.6% |
| Immigrants | Bolivia | 11.0 /100 | #213 | Poor 35.6% |
| Apache | 11.0 /100 | #214 | Poor 35.6% |
| Immigrants | South Eastern Asia | 10.8 /100 | #215 | Poor 35.6% |