Blackfeet vs Immigrants from Belgium Family Poverty
COMPARE
Blackfeet
Immigrants from Belgium
Family Poverty
Family Poverty Comparison
Blackfeet
Immigrants from Belgium
11.3%
FAMILY POVERTY
0.0/ 100
METRIC RATING
279th/ 347
METRIC RANK
7.8%
FAMILY POVERTY
98.2/ 100
METRIC RATING
69th/ 347
METRIC RANK
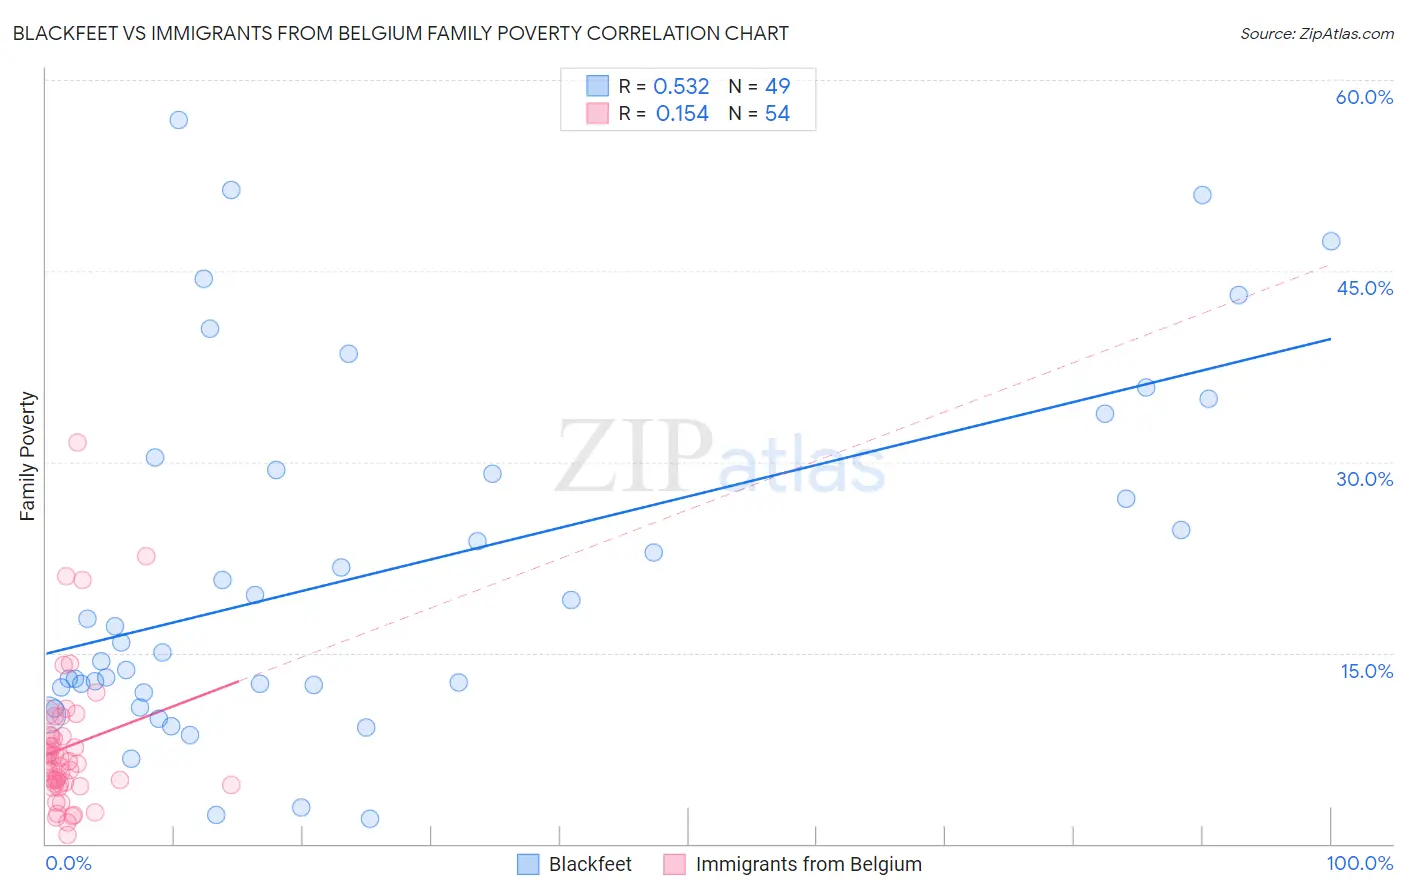
Blackfeet vs Immigrants from Belgium Family Poverty Correlation Chart
The statistical analysis conducted on geographies consisting of 309,172,576 people shows a substantial positive correlation between the proportion of Blackfeet and poverty level among families in the United States with a correlation coefficient (R) of 0.532 and weighted average of 11.3%. Similarly, the statistical analysis conducted on geographies consisting of 146,524,248 people shows a poor positive correlation between the proportion of Immigrants from Belgium and poverty level among families in the United States with a correlation coefficient (R) of 0.154 and weighted average of 7.8%, a difference of 43.9%.
Family Poverty Correlation Summary
| Measurement | Blackfeet | Immigrants from Belgium |
| Minimum | 2.0% | 0.69% |
| Maximum | 56.9% | 31.5% |
| Range | 54.9% | 30.8% |
| Mean | 21.4% | 7.6% |
| Median | 15.8% | 6.4% |
| Interquartile 25% (IQ1) | 12.1% | 4.7% |
| Interquartile 75% (IQ3) | 29.9% | 8.4% |
| Interquartile Range (IQR) | 17.8% | 3.7% |
| Standard Deviation (Sample) | 14.0% | 5.6% |
| Standard Deviation (Population) | 13.9% | 5.6% |
Similar Demographics by Family Poverty
Demographics Similar to Blackfeet by Family Poverty
In terms of family poverty, the demographic groups most similar to Blackfeet are Belizean (11.3%, a difference of 0.040%), Guyanese (11.2%, a difference of 0.14%), Chippewa (11.2%, a difference of 0.16%), Immigrants from Guyana (11.2%, a difference of 0.25%), and Central American (11.2%, a difference of 0.28%).
| Demographics | Rating | Rank | Family Poverty |
| Immigrants | Jamaica | 0.1 /100 | #272 | Tragic 11.2% |
| Somalis | 0.1 /100 | #273 | Tragic 11.2% |
| Spanish Americans | 0.1 /100 | #274 | Tragic 11.2% |
| Central Americans | 0.1 /100 | #275 | Tragic 11.2% |
| Immigrants | Guyana | 0.1 /100 | #276 | Tragic 11.2% |
| Chippewa | 0.1 /100 | #277 | Tragic 11.2% |
| Guyanese | 0.1 /100 | #278 | Tragic 11.2% |
| Blackfeet | 0.0 /100 | #279 | Tragic 11.3% |
| Belizeans | 0.0 /100 | #280 | Tragic 11.3% |
| Immigrants | West Indies | 0.0 /100 | #281 | Tragic 11.3% |
| Immigrants | Cuba | 0.0 /100 | #282 | Tragic 11.3% |
| Indonesians | 0.0 /100 | #283 | Tragic 11.3% |
| Yaqui | 0.0 /100 | #284 | Tragic 11.3% |
| Barbadians | 0.0 /100 | #285 | Tragic 11.3% |
| Senegalese | 0.0 /100 | #286 | Tragic 11.5% |
Demographics Similar to Immigrants from Belgium by Family Poverty
In terms of family poverty, the demographic groups most similar to Immigrants from Belgium are Australian (7.8%, a difference of 0.010%), Immigrants from Canada (7.8%, a difference of 0.040%), Northern European (7.8%, a difference of 0.050%), Dutch (7.8%, a difference of 0.060%), and Cambodian (7.8%, a difference of 0.060%).
| Demographics | Rating | Rank | Family Poverty |
| Macedonians | 98.6 /100 | #62 | Exceptional 7.8% |
| Zimbabweans | 98.4 /100 | #63 | Exceptional 7.8% |
| Koreans | 98.3 /100 | #64 | Exceptional 7.8% |
| Immigrants | Bulgaria | 98.3 /100 | #65 | Exceptional 7.8% |
| Dutch | 98.3 /100 | #66 | Exceptional 7.8% |
| Northern Europeans | 98.3 /100 | #67 | Exceptional 7.8% |
| Australians | 98.2 /100 | #68 | Exceptional 7.8% |
| Immigrants | Belgium | 98.2 /100 | #69 | Exceptional 7.8% |
| Immigrants | Canada | 98.2 /100 | #70 | Exceptional 7.8% |
| Cambodians | 98.2 /100 | #71 | Exceptional 7.8% |
| Immigrants | Romania | 98.2 /100 | #72 | Exceptional 7.8% |
| Austrians | 98.2 /100 | #73 | Exceptional 7.8% |
| Immigrants | China | 98.1 /100 | #74 | Exceptional 7.8% |
| Immigrants | Croatia | 98.1 /100 | #75 | Exceptional 7.8% |
| Immigrants | Latvia | 98.0 /100 | #76 | Exceptional 7.9% |