Tohono O'odham vs Immigrants from Lebanon Female Poverty Among 18-24 Year Olds
COMPARE
Tohono O'odham
Immigrants from Lebanon
Female Poverty Among 18-24 Year Olds
Female Poverty Among 18-24 Year Olds Comparison
Tohono O'odham
Immigrants from Lebanon
31.0%
FEMALE POVERTY AMONG 18-24 YEAR OLDS
0.0/ 100
METRIC RATING
345th/ 347
METRIC RANK
19.8%
FEMALE POVERTY AMONG 18-24 YEAR OLDS
75.3/ 100
METRIC RATING
158th/ 347
METRIC RANK
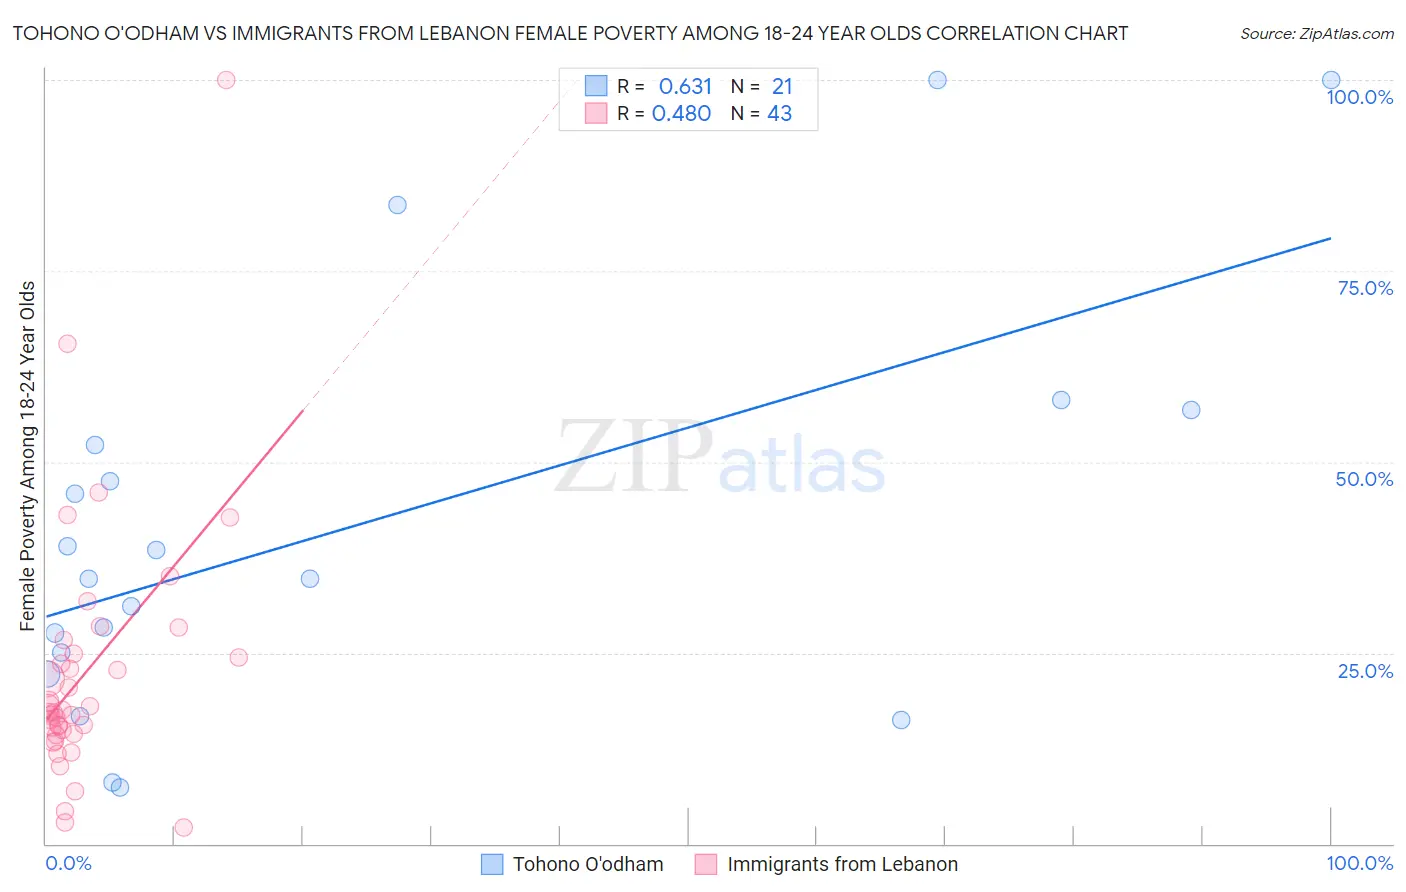
Tohono O'odham vs Immigrants from Lebanon Female Poverty Among 18-24 Year Olds Correlation Chart
The statistical analysis conducted on geographies consisting of 58,612,665 people shows a significant positive correlation between the proportion of Tohono O'odham and poverty level among females between the ages 18 and 24 in the United States with a correlation coefficient (R) of 0.631 and weighted average of 31.0%. Similarly, the statistical analysis conducted on geographies consisting of 214,316,536 people shows a moderate positive correlation between the proportion of Immigrants from Lebanon and poverty level among females between the ages 18 and 24 in the United States with a correlation coefficient (R) of 0.480 and weighted average of 19.8%, a difference of 56.4%.
Female Poverty Among 18-24 Year Olds Correlation Summary
| Measurement | Tohono O'odham | Immigrants from Lebanon |
| Minimum | 7.4% | 2.1% |
| Maximum | 100.0% | 100.0% |
| Range | 92.6% | 97.9% |
| Mean | 41.6% | 22.4% |
| Median | 34.7% | 17.2% |
| Interquartile 25% (IQ1) | 23.7% | 14.4% |
| Interquartile 75% (IQ3) | 54.5% | 24.8% |
| Interquartile Range (IQR) | 30.8% | 10.5% |
| Standard Deviation (Sample) | 26.5% | 17.0% |
| Standard Deviation (Population) | 25.9% | 16.8% |
Similar Demographics by Female Poverty Among 18-24 Year Olds
Demographics Similar to Tohono O'odham by Female Poverty Among 18-24 Year Olds
In terms of female poverty among 18-24 year olds, the demographic groups most similar to Tohono O'odham are Lumbee (31.1%, a difference of 0.16%), Navajo (30.3%, a difference of 2.3%), Puerto Rican (29.8%, a difference of 3.9%), Kiowa (29.2%, a difference of 6.1%), and Colville (29.0%, a difference of 6.9%).
| Demographics | Rating | Rank | Female Poverty Among 18-24 Year Olds |
| Apache | 0.0 /100 | #333 | Tragic 26.3% |
| Pueblo | 0.0 /100 | #334 | Tragic 26.9% |
| Yup'ik | 0.0 /100 | #335 | Tragic 27.0% |
| Immigrants | Yemen | 0.0 /100 | #336 | Tragic 27.5% |
| Cheyenne | 0.0 /100 | #337 | Tragic 28.1% |
| Hopi | 0.0 /100 | #338 | Tragic 28.2% |
| Pima | 0.0 /100 | #339 | Tragic 28.4% |
| Sioux | 0.0 /100 | #340 | Tragic 28.6% |
| Colville | 0.0 /100 | #341 | Tragic 29.0% |
| Kiowa | 0.0 /100 | #342 | Tragic 29.2% |
| Puerto Ricans | 0.0 /100 | #343 | Tragic 29.8% |
| Navajo | 0.0 /100 | #344 | Tragic 30.3% |
| Tohono O'odham | 0.0 /100 | #345 | Tragic 31.0% |
| Lumbee | 0.0 /100 | #346 | Tragic 31.1% |
| Crow | 0.0 /100 | #347 | Tragic 33.2% |
Demographics Similar to Immigrants from Lebanon by Female Poverty Among 18-24 Year Olds
In terms of female poverty among 18-24 year olds, the demographic groups most similar to Immigrants from Lebanon are Danish (19.8%, a difference of 0.020%), Trinidadian and Tobagonian (19.8%, a difference of 0.060%), Immigrants from Belgium (19.8%, a difference of 0.080%), Pakistani (19.8%, a difference of 0.080%), and Immigrants from Belize (19.8%, a difference of 0.080%).
| Demographics | Rating | Rank | Female Poverty Among 18-24 Year Olds |
| Immigrants | Eastern Asia | 79.7 /100 | #151 | Good 19.8% |
| Yugoslavians | 79.0 /100 | #152 | Good 19.8% |
| Immigrants | Japan | 78.1 /100 | #153 | Good 19.8% |
| Immigrants | Zimbabwe | 76.7 /100 | #154 | Good 19.8% |
| Hungarians | 76.6 /100 | #155 | Good 19.8% |
| Immigrants | Belgium | 76.4 /100 | #156 | Good 19.8% |
| Danes | 75.5 /100 | #157 | Good 19.8% |
| Immigrants | Lebanon | 75.3 /100 | #158 | Good 19.8% |
| Trinidadians and Tobagonians | 74.4 /100 | #159 | Good 19.8% |
| Pakistanis | 74.1 /100 | #160 | Good 19.8% |
| Immigrants | Belize | 74.1 /100 | #161 | Good 19.8% |
| French Canadians | 73.0 /100 | #162 | Good 19.9% |
| Malaysians | 72.7 /100 | #163 | Good 19.9% |
| Central Americans | 70.0 /100 | #164 | Good 19.9% |
| Eastern Europeans | 69.3 /100 | #165 | Good 19.9% |