Immigrants from Northern Africa vs Immigrants from Lebanon Female Poverty Among 18-24 Year Olds
COMPARE
Immigrants from Northern Africa
Immigrants from Lebanon
Female Poverty Among 18-24 Year Olds
Female Poverty Among 18-24 Year Olds Comparison
Immigrants from Northern Africa
Immigrants from Lebanon
19.7%
FEMALE POVERTY AMONG 18-24 YEAR OLDS
84.1/ 100
METRIC RATING
144th/ 347
METRIC RANK
19.8%
FEMALE POVERTY AMONG 18-24 YEAR OLDS
75.3/ 100
METRIC RATING
158th/ 347
METRIC RANK
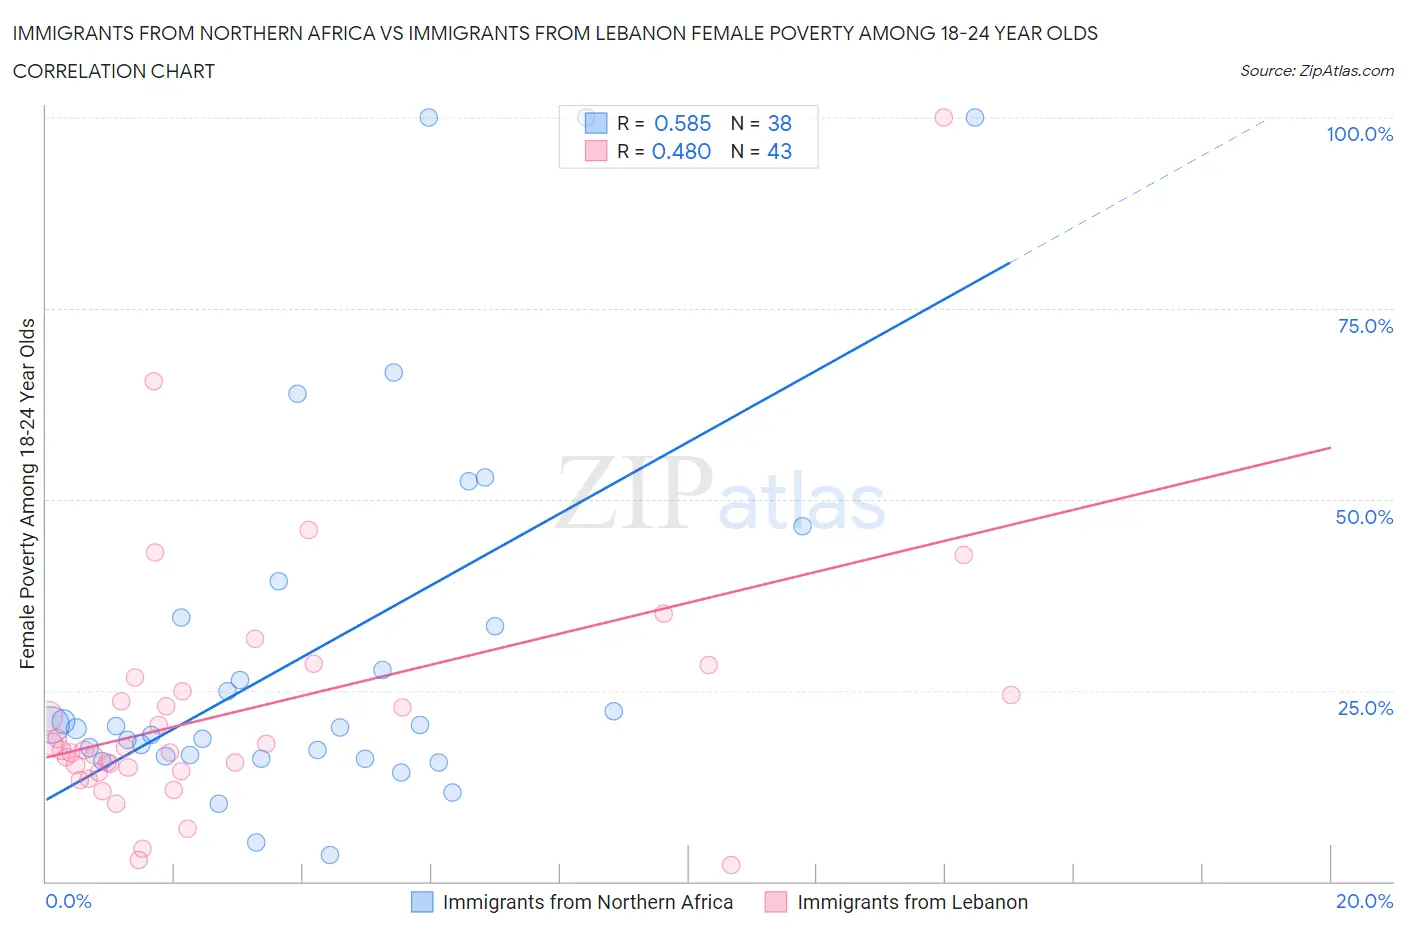
Immigrants from Northern Africa vs Immigrants from Lebanon Female Poverty Among 18-24 Year Olds Correlation Chart
The statistical analysis conducted on geographies consisting of 315,545,962 people shows a substantial positive correlation between the proportion of Immigrants from Northern Africa and poverty level among females between the ages 18 and 24 in the United States with a correlation coefficient (R) of 0.585 and weighted average of 19.7%. Similarly, the statistical analysis conducted on geographies consisting of 214,316,536 people shows a moderate positive correlation between the proportion of Immigrants from Lebanon and poverty level among females between the ages 18 and 24 in the United States with a correlation coefficient (R) of 0.480 and weighted average of 19.8%, a difference of 0.69%.
Female Poverty Among 18-24 Year Olds Correlation Summary
| Measurement | Immigrants from Northern Africa | Immigrants from Lebanon |
| Minimum | 3.4% | 2.1% |
| Maximum | 100.0% | 100.0% |
| Range | 96.6% | 97.9% |
| Mean | 30.6% | 22.4% |
| Median | 20.2% | 17.2% |
| Interquartile 25% (IQ1) | 16.4% | 14.4% |
| Interquartile 75% (IQ3) | 34.5% | 24.8% |
| Interquartile Range (IQR) | 18.1% | 10.5% |
| Standard Deviation (Sample) | 25.2% | 17.0% |
| Standard Deviation (Population) | 24.9% | 16.8% |
Demographics Similar to Immigrants from Northern Africa and Immigrants from Lebanon by Female Poverty Among 18-24 Year Olds
In terms of female poverty among 18-24 year olds, the demographic groups most similar to Immigrants from Northern Africa are Slavic (19.7%, a difference of 0.030%), Canadian (19.7%, a difference of 0.030%), Panamanian (19.7%, a difference of 0.040%), Immigrants from Bosnia and Herzegovina (19.7%, a difference of 0.050%), and Immigrants from Austria (19.7%, a difference of 0.090%). Similarly, the demographic groups most similar to Immigrants from Lebanon are Danish (19.8%, a difference of 0.020%), Trinidadian and Tobagonian (19.8%, a difference of 0.060%), Immigrants from Belgium (19.8%, a difference of 0.080%), Pakistani (19.8%, a difference of 0.080%), and Immigrants from Belize (19.8%, a difference of 0.080%).
| Demographics | Rating | Rank | Female Poverty Among 18-24 Year Olds |
| Pennsylvania Germans | 85.5 /100 | #141 | Excellent 19.7% |
| Panamanians | 84.6 /100 | #142 | Excellent 19.7% |
| Slavs | 84.4 /100 | #143 | Excellent 19.7% |
| Immigrants | Northern Africa | 84.1 /100 | #144 | Excellent 19.7% |
| Canadians | 83.8 /100 | #145 | Excellent 19.7% |
| Immigrants | Bosnia and Herzegovina | 83.6 /100 | #146 | Excellent 19.7% |
| Immigrants | Austria | 83.1 /100 | #147 | Excellent 19.7% |
| Immigrants | Latin America | 81.3 /100 | #148 | Excellent 19.7% |
| Immigrants | Oceania | 81.2 /100 | #149 | Excellent 19.7% |
| Syrians | 80.2 /100 | #150 | Excellent 19.8% |
| Immigrants | Eastern Asia | 79.7 /100 | #151 | Good 19.8% |
| Yugoslavians | 79.0 /100 | #152 | Good 19.8% |
| Immigrants | Japan | 78.1 /100 | #153 | Good 19.8% |
| Immigrants | Zimbabwe | 76.7 /100 | #154 | Good 19.8% |
| Hungarians | 76.6 /100 | #155 | Good 19.8% |
| Immigrants | Belgium | 76.4 /100 | #156 | Good 19.8% |
| Danes | 75.5 /100 | #157 | Good 19.8% |
| Immigrants | Lebanon | 75.3 /100 | #158 | Good 19.8% |
| Trinidadians and Tobagonians | 74.4 /100 | #159 | Good 19.8% |
| Pakistanis | 74.1 /100 | #160 | Good 19.8% |
| Immigrants | Belize | 74.1 /100 | #161 | Good 19.8% |