Thai vs Immigrants from Israel Female Poverty Among 25-34 Year Olds
COMPARE
Thai
Immigrants from Israel
Female Poverty Among 25-34 Year Olds
Female Poverty Among 25-34 Year Olds Comparison
Thais
Immigrants from Israel
10.2%
FEMALE POVERTY AMONG 25-34 YEAR OLDS
100.0/ 100
METRIC RATING
4th/ 347
METRIC RANK
12.0%
FEMALE POVERTY AMONG 25-34 YEAR OLDS
99.6/ 100
METRIC RATING
53rd/ 347
METRIC RANK
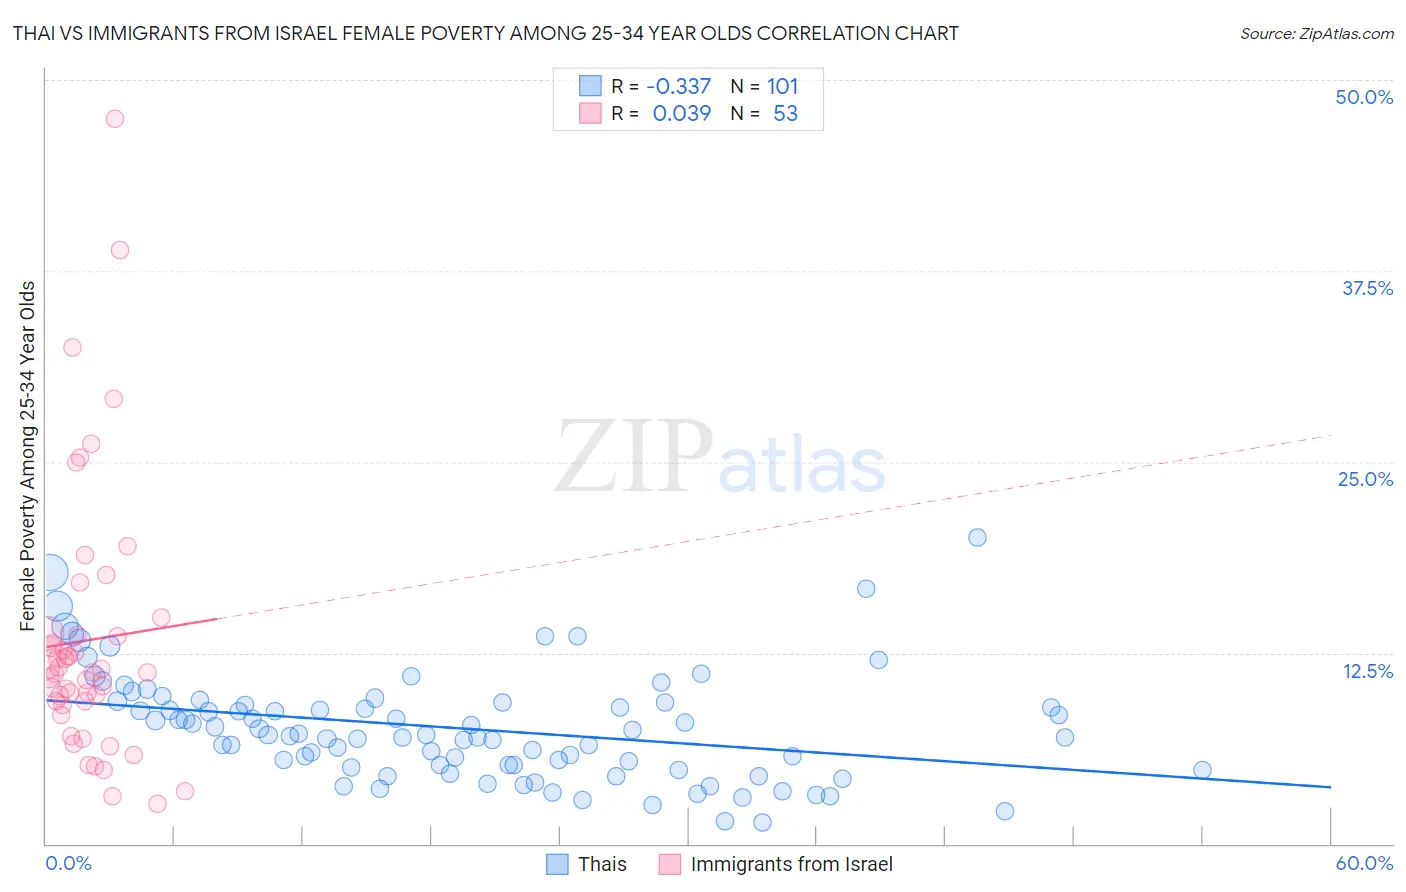
Thai vs Immigrants from Israel Female Poverty Among 25-34 Year Olds Correlation Chart
The statistical analysis conducted on geographies consisting of 465,466,782 people shows a mild negative correlation between the proportion of Thais and poverty level among females between the ages 25 and 34 in the United States with a correlation coefficient (R) of -0.337 and weighted average of 10.2%. Similarly, the statistical analysis conducted on geographies consisting of 207,529,391 people shows no correlation between the proportion of Immigrants from Israel and poverty level among females between the ages 25 and 34 in the United States with a correlation coefficient (R) of 0.039 and weighted average of 12.0%, a difference of 17.2%.
Female Poverty Among 25-34 Year Olds Correlation Summary
| Measurement | Thai | Immigrants from Israel |
| Minimum | 1.4% | 2.6% |
| Maximum | 20.1% | 47.5% |
| Range | 18.6% | 44.8% |
| Mean | 7.6% | 13.3% |
| Median | 7.1% | 11.2% |
| Interquartile 25% (IQ1) | 5.1% | 9.2% |
| Interquartile 75% (IQ3) | 9.2% | 13.7% |
| Interquartile Range (IQR) | 4.1% | 4.5% |
| Standard Deviation (Sample) | 3.5% | 8.7% |
| Standard Deviation (Population) | 3.5% | 8.6% |
Similar Demographics by Female Poverty Among 25-34 Year Olds
Demographics Similar to Thais by Female Poverty Among 25-34 Year Olds
In terms of female poverty among 25-34 year olds, the demographic groups most similar to Thais are Filipino (10.2%, a difference of 0.17%), Immigrants from Hong Kong (10.4%, a difference of 1.4%), Immigrants from Taiwan (10.0%, a difference of 2.2%), Immigrants from South Central Asia (10.8%, a difference of 5.1%), and Immigrants from India (9.7%, a difference of 5.4%).
| Demographics | Rating | Rank | Female Poverty Among 25-34 Year Olds |
| Immigrants | India | 100.0 /100 | #1 | Exceptional 9.7% |
| Immigrants | Taiwan | 100.0 /100 | #2 | Exceptional 10.0% |
| Filipinos | 100.0 /100 | #3 | Exceptional 10.2% |
| Thais | 100.0 /100 | #4 | Exceptional 10.2% |
| Immigrants | Hong Kong | 100.0 /100 | #5 | Exceptional 10.4% |
| Immigrants | South Central Asia | 100.0 /100 | #6 | Exceptional 10.8% |
| Chinese | 100.0 /100 | #7 | Exceptional 11.0% |
| Immigrants | Iran | 100.0 /100 | #8 | Exceptional 11.0% |
| Immigrants | Singapore | 100.0 /100 | #9 | Exceptional 11.1% |
| Immigrants | Lithuania | 100.0 /100 | #10 | Exceptional 11.1% |
| Immigrants | Korea | 100.0 /100 | #11 | Exceptional 11.1% |
| Immigrants | Ireland | 100.0 /100 | #12 | Exceptional 11.2% |
| Burmese | 100.0 /100 | #13 | Exceptional 11.2% |
| Indians (Asian) | 100.0 /100 | #14 | Exceptional 11.2% |
| Assyrians/Chaldeans/Syriacs | 100.0 /100 | #15 | Exceptional 11.2% |
Demographics Similar to Immigrants from Israel by Female Poverty Among 25-34 Year Olds
In terms of female poverty among 25-34 year olds, the demographic groups most similar to Immigrants from Israel are Immigrants from Eastern Europe (12.0%, a difference of 0.12%), Eastern European (12.0%, a difference of 0.12%), Paraguayan (12.0%, a difference of 0.14%), Immigrants from Croatia (12.0%, a difference of 0.15%), and Immigrants from Egypt (12.0%, a difference of 0.16%).
| Demographics | Rating | Rank | Female Poverty Among 25-34 Year Olds |
| Immigrants | Serbia | 99.7 /100 | #46 | Exceptional 11.9% |
| Koreans | 99.6 /100 | #47 | Exceptional 12.0% |
| Immigrants | Belarus | 99.6 /100 | #48 | Exceptional 12.0% |
| Immigrants | Egypt | 99.6 /100 | #49 | Exceptional 12.0% |
| Immigrants | Croatia | 99.6 /100 | #50 | Exceptional 12.0% |
| Paraguayans | 99.6 /100 | #51 | Exceptional 12.0% |
| Immigrants | Eastern Europe | 99.6 /100 | #52 | Exceptional 12.0% |
| Immigrants | Israel | 99.6 /100 | #53 | Exceptional 12.0% |
| Eastern Europeans | 99.6 /100 | #54 | Exceptional 12.0% |
| Immigrants | Philippines | 99.5 /100 | #55 | Exceptional 12.0% |
| Luxembourgers | 99.5 /100 | #56 | Exceptional 12.1% |
| Jordanians | 99.4 /100 | #57 | Exceptional 12.1% |
| Immigrants | Romania | 99.4 /100 | #58 | Exceptional 12.1% |
| Russians | 99.4 /100 | #59 | Exceptional 12.1% |
| Immigrants | Northern Europe | 99.4 /100 | #60 | Exceptional 12.1% |