Immigrants from Ethiopia vs Immigrants from Dominica Child Poverty Under the Age of 5
COMPARE
Immigrants from Ethiopia
Immigrants from Dominica
Child Poverty Under the Age of 5
Child Poverty Under the Age of 5 Comparison
Immigrants from Ethiopia
Immigrants from Dominica
16.6%
CHILD POVERTY UNDER THE AGE OF 5
82.1/ 100
METRIC RATING
145th/ 347
METRIC RANK
22.7%
CHILD POVERTY UNDER THE AGE OF 5
0.0/ 100
METRIC RATING
308th/ 347
METRIC RANK
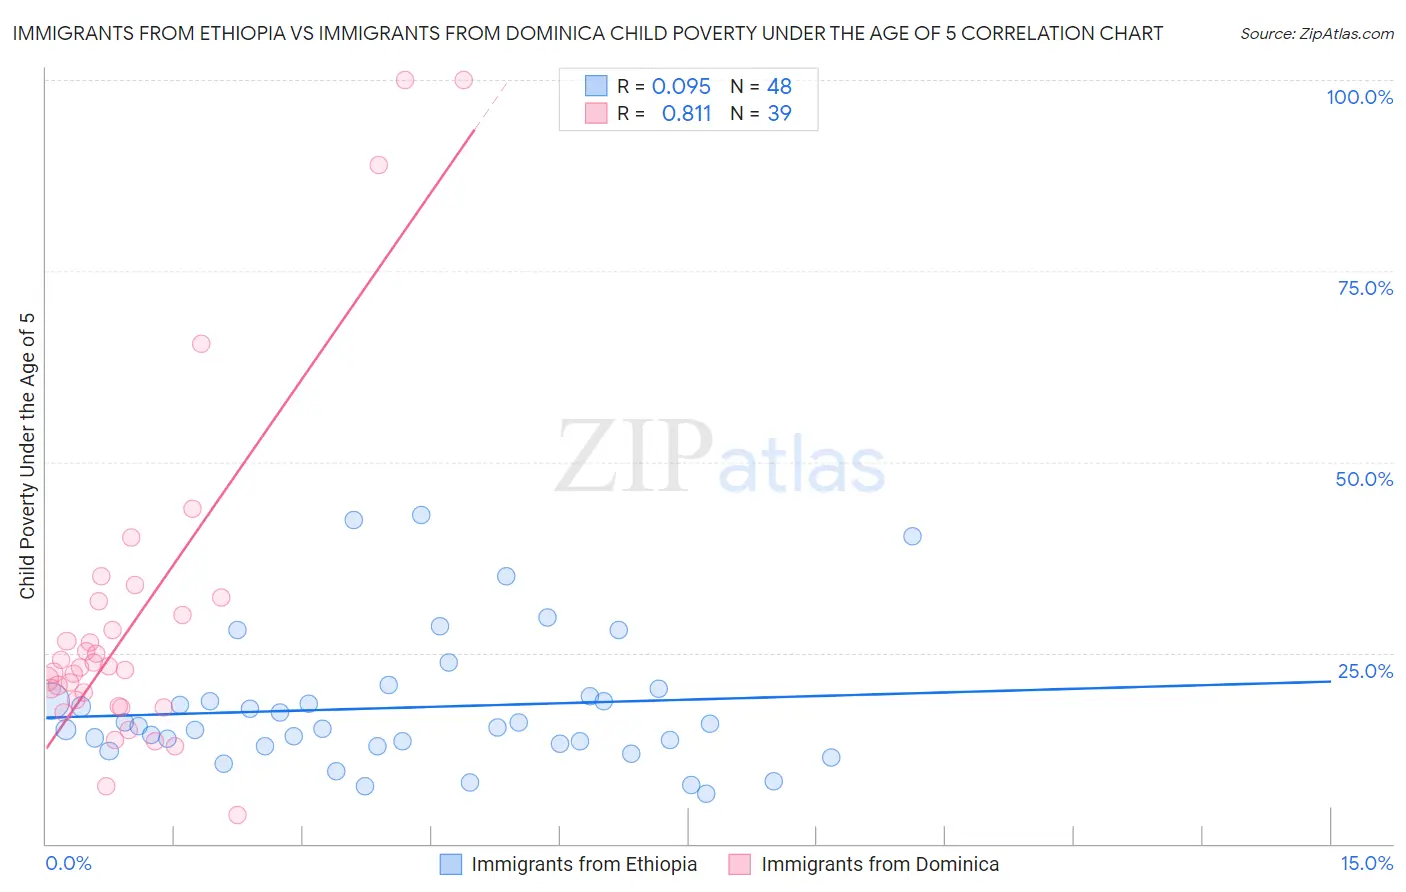
Immigrants from Ethiopia vs Immigrants from Dominica Child Poverty Under the Age of 5 Correlation Chart
The statistical analysis conducted on geographies consisting of 207,314,219 people shows a slight positive correlation between the proportion of Immigrants from Ethiopia and poverty level among children under the age of 5 in the United States with a correlation coefficient (R) of 0.095 and weighted average of 16.6%. Similarly, the statistical analysis conducted on geographies consisting of 83,100,488 people shows a very strong positive correlation between the proportion of Immigrants from Dominica and poverty level among children under the age of 5 in the United States with a correlation coefficient (R) of 0.811 and weighted average of 22.7%, a difference of 37.1%.
Child Poverty Under the Age of 5 Correlation Summary
| Measurement | Immigrants from Ethiopia | Immigrants from Dominica |
| Minimum | 6.5% | 3.8% |
| Maximum | 43.1% | 100.0% |
| Range | 36.6% | 96.2% |
| Mean | 17.8% | 29.6% |
| Median | 15.3% | 23.1% |
| Interquartile 25% (IQ1) | 13.0% | 17.9% |
| Interquartile 75% (IQ3) | 19.0% | 31.8% |
| Interquartile Range (IQR) | 6.0% | 13.9% |
| Standard Deviation (Sample) | 8.7% | 22.2% |
| Standard Deviation (Population) | 8.6% | 21.9% |
Similar Demographics by Child Poverty Under the Age of 5
Demographics Similar to Immigrants from Ethiopia by Child Poverty Under the Age of 5
In terms of child poverty under the age of 5, the demographic groups most similar to Immigrants from Ethiopia are Israeli (16.6%, a difference of 0.020%), Ethiopian (16.5%, a difference of 0.11%), Samoan (16.5%, a difference of 0.17%), Portuguese (16.5%, a difference of 0.18%), and Immigrants from Western Europe (16.5%, a difference of 0.22%).
| Demographics | Rating | Rank | Child Poverty Under the Age of 5 |
| Germans | 84.8 /100 | #138 | Excellent 16.5% |
| Immigrants | Hungary | 84.5 /100 | #139 | Excellent 16.5% |
| Guamanians/Chamorros | 84.2 /100 | #140 | Excellent 16.5% |
| Immigrants | Western Europe | 83.3 /100 | #141 | Excellent 16.5% |
| Portuguese | 83.0 /100 | #142 | Excellent 16.5% |
| Samoans | 83.0 /100 | #143 | Excellent 16.5% |
| Ethiopians | 82.7 /100 | #144 | Excellent 16.5% |
| Immigrants | Ethiopia | 82.1 /100 | #145 | Excellent 16.6% |
| Israelis | 82.0 /100 | #146 | Excellent 16.6% |
| Immigrants | Nepal | 80.3 /100 | #147 | Excellent 16.6% |
| Syrians | 79.1 /100 | #148 | Good 16.6% |
| New Zealanders | 78.7 /100 | #149 | Good 16.6% |
| Colombians | 77.8 /100 | #150 | Good 16.7% |
| Canadians | 77.6 /100 | #151 | Good 16.7% |
| Belgians | 77.2 /100 | #152 | Good 16.7% |
Demographics Similar to Immigrants from Dominica by Child Poverty Under the Age of 5
In terms of child poverty under the age of 5, the demographic groups most similar to Immigrants from Dominica are Immigrants from Bahamas (22.7%, a difference of 0.040%), Houma (22.7%, a difference of 0.14%), African (22.8%, a difference of 0.55%), Seminole (22.8%, a difference of 0.59%), and Honduran (23.0%, a difference of 1.2%).
| Demographics | Rating | Rank | Child Poverty Under the Age of 5 |
| Immigrants | Central America | 0.0 /100 | #301 | Tragic 22.0% |
| Iroquois | 0.0 /100 | #302 | Tragic 22.0% |
| Inupiat | 0.0 /100 | #303 | Tragic 22.0% |
| Immigrants | Guatemala | 0.0 /100 | #304 | Tragic 22.0% |
| Immigrants | Mexico | 0.0 /100 | #305 | Tragic 22.2% |
| Indonesians | 0.0 /100 | #306 | Tragic 22.3% |
| Immigrants | Bahamas | 0.0 /100 | #307 | Tragic 22.7% |
| Immigrants | Dominica | 0.0 /100 | #308 | Tragic 22.7% |
| Houma | 0.0 /100 | #309 | Tragic 22.7% |
| Africans | 0.0 /100 | #310 | Tragic 22.8% |
| Seminole | 0.0 /100 | #311 | Tragic 22.8% |
| Hondurans | 0.0 /100 | #312 | Tragic 23.0% |
| Bahamians | 0.0 /100 | #313 | Tragic 23.0% |
| U.S. Virgin Islanders | 0.0 /100 | #314 | Tragic 23.0% |
| Arapaho | 0.0 /100 | #315 | Tragic 23.1% |