Immigrants from Africa vs Mongolian Male Poverty
COMPARE
Immigrants from Africa
Mongolian
Male Poverty
Male Poverty Comparison
Immigrants from Africa
Mongolians
12.2%
MALE POVERTY
2.1/ 100
METRIC RATING
222nd/ 347
METRIC RANK
11.3%
MALE POVERTY
39.0/ 100
METRIC RATING
182nd/ 347
METRIC RANK
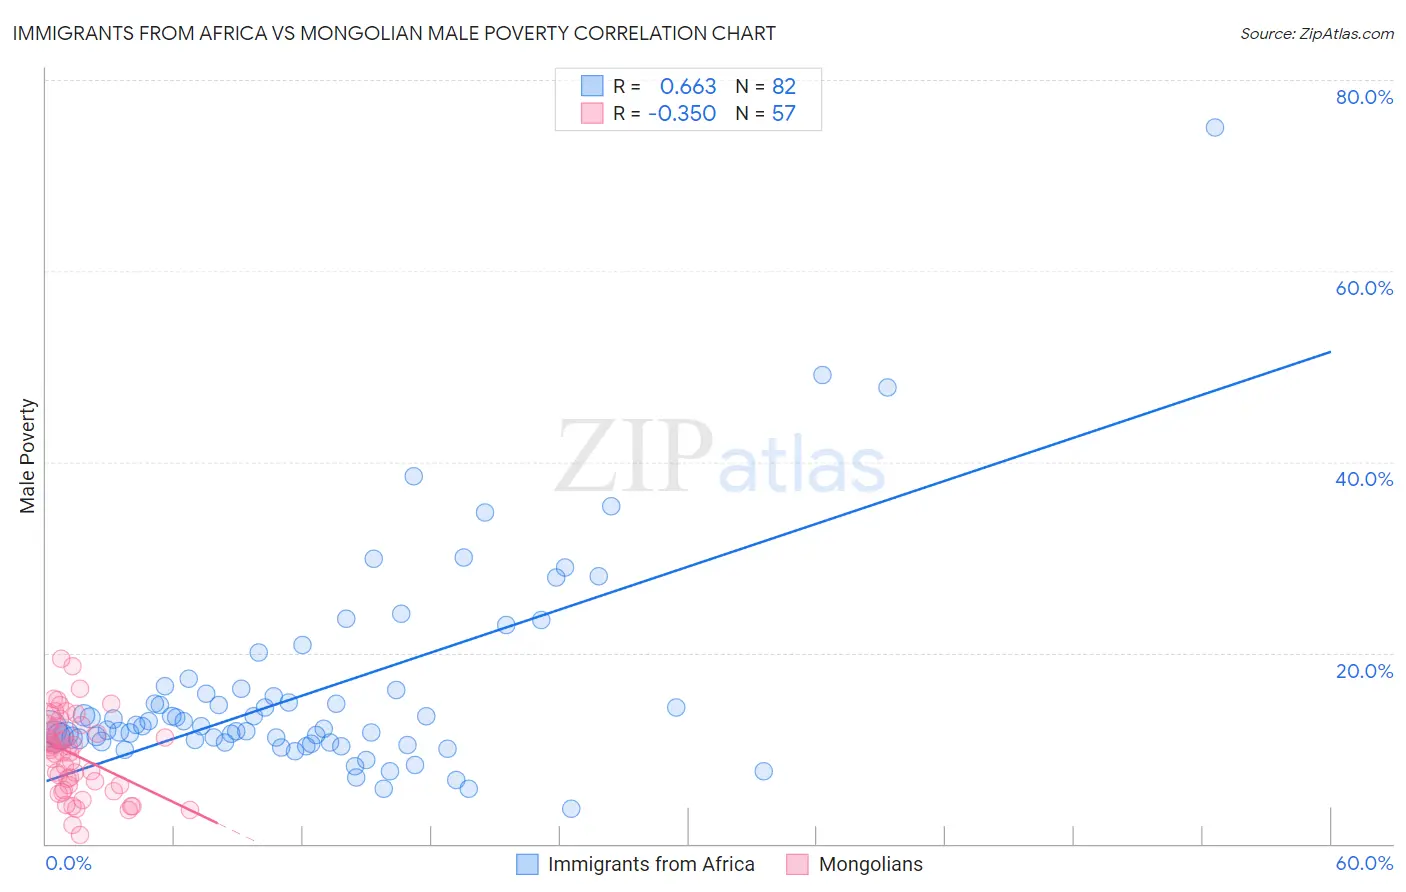
Immigrants from Africa vs Mongolian Male Poverty Correlation Chart
The statistical analysis conducted on geographies consisting of 468,698,192 people shows a significant positive correlation between the proportion of Immigrants from Africa and poverty level among males in the United States with a correlation coefficient (R) of 0.663 and weighted average of 12.2%. Similarly, the statistical analysis conducted on geographies consisting of 140,285,777 people shows a mild negative correlation between the proportion of Mongolians and poverty level among males in the United States with a correlation coefficient (R) of -0.350 and weighted average of 11.3%, a difference of 8.2%.
Male Poverty Correlation Summary
| Measurement | Immigrants from Africa | Mongolian |
| Minimum | 3.7% | 0.97% |
| Maximum | 75.0% | 19.4% |
| Range | 71.3% | 18.5% |
| Mean | 16.0% | 9.3% |
| Median | 12.3% | 9.6% |
| Interquartile 25% (IQ1) | 10.7% | 5.9% |
| Interquartile 75% (IQ3) | 16.1% | 12.3% |
| Interquartile Range (IQR) | 5.4% | 6.4% |
| Standard Deviation (Sample) | 10.9% | 4.2% |
| Standard Deviation (Population) | 10.9% | 4.2% |
Similar Demographics by Male Poverty
Demographics Similar to Immigrants from Africa by Male Poverty
In terms of male poverty, the demographic groups most similar to Immigrants from Africa are Immigrants from Micronesia (12.2%, a difference of 0.010%), Ugandan (12.2%, a difference of 0.020%), Immigrants from Eritrea (12.2%, a difference of 0.23%), Bermudan (12.2%, a difference of 0.25%), and German Russian (12.2%, a difference of 0.32%).
| Demographics | Rating | Rank | Male Poverty |
| Immigrants | Uzbekistan | 2.6 /100 | #215 | Tragic 12.2% |
| Immigrants | Cambodia | 2.5 /100 | #216 | Tragic 12.2% |
| Immigrants | Thailand | 2.5 /100 | #217 | Tragic 12.2% |
| German Russians | 2.5 /100 | #218 | Tragic 12.2% |
| Bermudans | 2.4 /100 | #219 | Tragic 12.2% |
| Immigrants | Eritrea | 2.4 /100 | #220 | Tragic 12.2% |
| Ugandans | 2.2 /100 | #221 | Tragic 12.2% |
| Immigrants | Africa | 2.1 /100 | #222 | Tragic 12.2% |
| Immigrants | Micronesia | 2.1 /100 | #223 | Tragic 12.2% |
| Immigrants | Nigeria | 1.6 /100 | #224 | Tragic 12.3% |
| Osage | 1.5 /100 | #225 | Tragic 12.3% |
| Nigerians | 1.4 /100 | #226 | Tragic 12.3% |
| Alaska Natives | 1.4 /100 | #227 | Tragic 12.4% |
| Alsatians | 1.3 /100 | #228 | Tragic 12.4% |
| Cubans | 1.3 /100 | #229 | Tragic 12.4% |
Demographics Similar to Mongolians by Male Poverty
In terms of male poverty, the demographic groups most similar to Mongolians are Immigrants from Costa Rica (11.3%, a difference of 0.050%), Kenyan (11.3%, a difference of 0.060%), Immigrants from Morocco (11.3%, a difference of 0.11%), Immigrants from Syria (11.3%, a difference of 0.13%), and Immigrants from South America (11.3%, a difference of 0.22%).
| Demographics | Rating | Rank | Male Poverty |
| Celtics | 47.5 /100 | #175 | Average 11.2% |
| Immigrants | Fiji | 46.0 /100 | #176 | Average 11.2% |
| Lebanese | 45.6 /100 | #177 | Average 11.2% |
| Immigrants | Cameroon | 44.5 /100 | #178 | Average 11.2% |
| Immigrants | Syria | 40.3 /100 | #179 | Average 11.3% |
| Immigrants | Morocco | 40.1 /100 | #180 | Average 11.3% |
| Immigrants | Costa Rica | 39.5 /100 | #181 | Fair 11.3% |
| Mongolians | 39.0 /100 | #182 | Fair 11.3% |
| Kenyans | 38.4 /100 | #183 | Fair 11.3% |
| Immigrants | South America | 36.9 /100 | #184 | Fair 11.3% |
| Immigrants | Afghanistan | 33.3 /100 | #185 | Fair 11.4% |
| Immigrants | Sierra Leone | 32.9 /100 | #186 | Fair 11.4% |
| Immigrants | Iraq | 31.9 /100 | #187 | Fair 11.4% |
| Sierra Leoneans | 29.9 /100 | #188 | Fair 11.4% |
| Hawaiians | 28.3 /100 | #189 | Fair 11.4% |