Swiss vs Spanish American Indian Seniors Poverty Over the Age of 75
COMPARE
Swiss
Spanish American Indian
Seniors Poverty Over the Age of 75
Seniors Poverty Over the Age of 75 Comparison
Swiss
Spanish American Indians
10.7%
SENIORS POVERTY OVER THE AGE OF 75
99.7/ 100
METRIC RATING
30th/ 347
METRIC RANK
15.5%
SENIORS POVERTY OVER THE AGE OF 75
0.0/ 100
METRIC RATING
299th/ 347
METRIC RANK
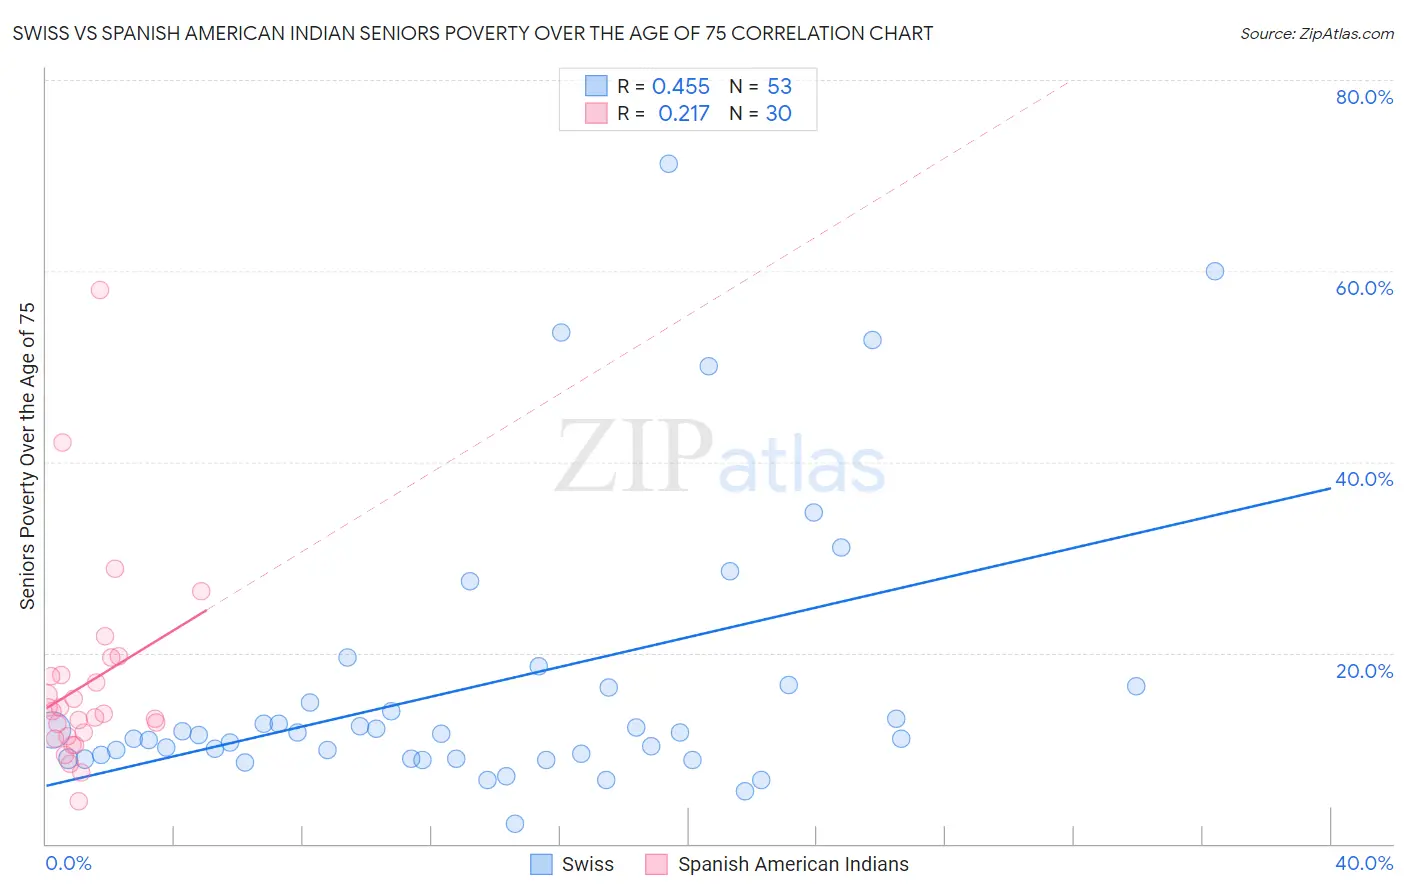
Swiss vs Spanish American Indian Seniors Poverty Over the Age of 75 Correlation Chart
The statistical analysis conducted on geographies consisting of 456,866,168 people shows a moderate positive correlation between the proportion of Swiss and poverty level among seniors over the age of 75 in the United States with a correlation coefficient (R) of 0.455 and weighted average of 10.7%. Similarly, the statistical analysis conducted on geographies consisting of 73,033,240 people shows a weak positive correlation between the proportion of Spanish American Indians and poverty level among seniors over the age of 75 in the United States with a correlation coefficient (R) of 0.217 and weighted average of 15.5%, a difference of 44.8%.
Seniors Poverty Over the Age of 75 Correlation Summary
| Measurement | Swiss | Spanish American Indian |
| Minimum | 2.1% | 4.4% |
| Maximum | 71.2% | 58.0% |
| Range | 69.1% | 53.6% |
| Mean | 16.7% | 16.8% |
| Median | 11.5% | 13.8% |
| Interquartile 25% (IQ1) | 8.9% | 11.2% |
| Interquartile 75% (IQ3) | 16.4% | 17.7% |
| Interquartile Range (IQR) | 7.5% | 6.5% |
| Standard Deviation (Sample) | 14.8% | 10.6% |
| Standard Deviation (Population) | 14.7% | 10.4% |
Similar Demographics by Seniors Poverty Over the Age of 75
Demographics Similar to Swiss by Seniors Poverty Over the Age of 75
In terms of seniors poverty over the age of 75, the demographic groups most similar to Swiss are Assyrian/Chaldean/Syriac (10.7%, a difference of 0.080%), Marshallese (10.7%, a difference of 0.19%), Irish (10.7%, a difference of 0.23%), Northern European (10.7%, a difference of 0.29%), and British (10.7%, a difference of 0.32%).
| Demographics | Rating | Rank | Seniors Poverty Over the Age of 75 |
| Lithuanians | 99.8 /100 | #23 | Exceptional 10.6% |
| Poles | 99.8 /100 | #24 | Exceptional 10.6% |
| Menominee | 99.8 /100 | #25 | Exceptional 10.6% |
| Bulgarians | 99.8 /100 | #26 | Exceptional 10.7% |
| Northern Europeans | 99.8 /100 | #27 | Exceptional 10.7% |
| Irish | 99.8 /100 | #28 | Exceptional 10.7% |
| Assyrians/Chaldeans/Syriacs | 99.8 /100 | #29 | Exceptional 10.7% |
| Swiss | 99.7 /100 | #30 | Exceptional 10.7% |
| Marshallese | 99.7 /100 | #31 | Exceptional 10.7% |
| British | 99.7 /100 | #32 | Exceptional 10.7% |
| Puget Sound Salish | 99.7 /100 | #33 | Exceptional 10.8% |
| Italians | 99.7 /100 | #34 | Exceptional 10.8% |
| Luxembourgers | 99.6 /100 | #35 | Exceptional 10.8% |
| Scotch-Irish | 99.6 /100 | #36 | Exceptional 10.8% |
| Latvians | 99.6 /100 | #37 | Exceptional 10.8% |
Demographics Similar to Spanish American Indians by Seniors Poverty Over the Age of 75
In terms of seniors poverty over the age of 75, the demographic groups most similar to Spanish American Indians are Bahamian (15.5%, a difference of 0.010%), Native/Alaskan (15.5%, a difference of 0.10%), Honduran (15.4%, a difference of 0.44%), Yuman (15.4%, a difference of 0.72%), and Immigrants from Latin America (15.6%, a difference of 0.79%).
| Demographics | Rating | Rank | Seniors Poverty Over the Age of 75 |
| Colville | 0.0 /100 | #292 | Tragic 15.2% |
| Apache | 0.0 /100 | #293 | Tragic 15.3% |
| Immigrants | Jamaica | 0.0 /100 | #294 | Tragic 15.3% |
| U.S. Virgin Islanders | 0.0 /100 | #295 | Tragic 15.4% |
| Yuman | 0.0 /100 | #296 | Tragic 15.4% |
| Hondurans | 0.0 /100 | #297 | Tragic 15.4% |
| Natives/Alaskans | 0.0 /100 | #298 | Tragic 15.5% |
| Spanish American Indians | 0.0 /100 | #299 | Tragic 15.5% |
| Bahamians | 0.0 /100 | #300 | Tragic 15.5% |
| Immigrants | Latin America | 0.0 /100 | #301 | Tragic 15.6% |
| West Indians | 0.0 /100 | #302 | Tragic 15.7% |
| Immigrants | Honduras | 0.0 /100 | #303 | Tragic 15.7% |
| Immigrants | Trinidad and Tobago | 0.0 /100 | #304 | Tragic 15.7% |
| Ecuadorians | 0.0 /100 | #305 | Tragic 15.7% |
| Hispanics or Latinos | 0.0 /100 | #306 | Tragic 15.8% |