Immigrants from Armenia vs Spanish American Indian Seniors Poverty Over the Age of 75
COMPARE
Immigrants from Armenia
Spanish American Indian
Seniors Poverty Over the Age of 75
Seniors Poverty Over the Age of 75 Comparison
Immigrants from Armenia
Spanish American Indians
17.5%
SENIORS POVERTY OVER THE AGE OF 75
0.0/ 100
METRIC RATING
331st/ 347
METRIC RANK
15.5%
SENIORS POVERTY OVER THE AGE OF 75
0.0/ 100
METRIC RATING
299th/ 347
METRIC RANK
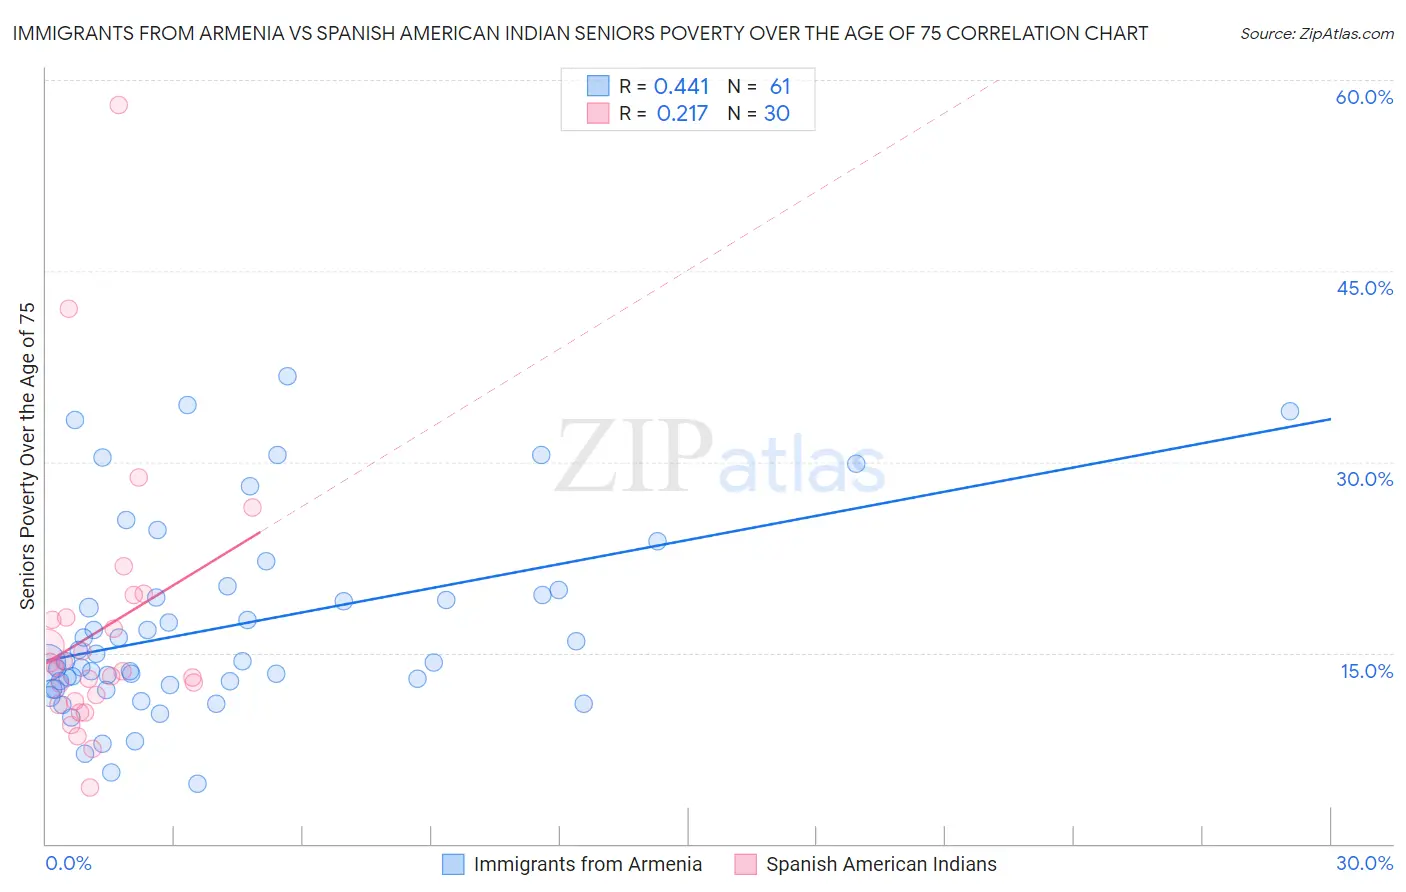
Immigrants from Armenia vs Spanish American Indian Seniors Poverty Over the Age of 75 Correlation Chart
The statistical analysis conducted on geographies consisting of 97,487,419 people shows a moderate positive correlation between the proportion of Immigrants from Armenia and poverty level among seniors over the age of 75 in the United States with a correlation coefficient (R) of 0.441 and weighted average of 17.5%. Similarly, the statistical analysis conducted on geographies consisting of 73,033,240 people shows a weak positive correlation between the proportion of Spanish American Indians and poverty level among seniors over the age of 75 in the United States with a correlation coefficient (R) of 0.217 and weighted average of 15.5%, a difference of 12.5%.
Seniors Poverty Over the Age of 75 Correlation Summary
| Measurement | Immigrants from Armenia | Spanish American Indian |
| Minimum | 4.7% | 4.4% |
| Maximum | 36.7% | 58.0% |
| Range | 32.1% | 53.6% |
| Mean | 17.1% | 16.8% |
| Median | 14.3% | 13.8% |
| Interquartile 25% (IQ1) | 12.3% | 11.2% |
| Interquartile 75% (IQ3) | 19.8% | 17.7% |
| Interquartile Range (IQR) | 7.4% | 6.5% |
| Standard Deviation (Sample) | 7.6% | 10.6% |
| Standard Deviation (Population) | 7.5% | 10.4% |
Similar Demographics by Seniors Poverty Over the Age of 75
Demographics Similar to Immigrants from Armenia by Seniors Poverty Over the Age of 75
In terms of seniors poverty over the age of 75, the demographic groups most similar to Immigrants from Armenia are British West Indian (17.4%, a difference of 0.26%), Immigrants from St. Vincent and the Grenadines (17.5%, a difference of 0.26%), Immigrants from Nicaragua (17.6%, a difference of 0.74%), Immigrants from Grenada (17.8%, a difference of 2.2%), and Immigrants from Dominica (17.0%, a difference of 2.7%).
| Demographics | Rating | Rank | Seniors Poverty Over the Age of 75 |
| Immigrants | Uzbekistan | 0.0 /100 | #324 | Tragic 16.5% |
| Nicaraguans | 0.0 /100 | #325 | Tragic 16.6% |
| Pueblo | 0.0 /100 | #326 | Tragic 16.7% |
| Sioux | 0.0 /100 | #327 | Tragic 16.8% |
| Cape Verdeans | 0.0 /100 | #328 | Tragic 16.8% |
| Immigrants | Dominica | 0.0 /100 | #329 | Tragic 17.0% |
| British West Indians | 0.0 /100 | #330 | Tragic 17.4% |
| Immigrants | Armenia | 0.0 /100 | #331 | Tragic 17.5% |
| Immigrants | St. Vincent and the Grenadines | 0.0 /100 | #332 | Tragic 17.5% |
| Immigrants | Nicaragua | 0.0 /100 | #333 | Tragic 17.6% |
| Immigrants | Grenada | 0.0 /100 | #334 | Tragic 17.8% |
| Cubans | 0.0 /100 | #335 | Tragic 18.0% |
| Immigrants | Caribbean | 0.0 /100 | #336 | Tragic 18.2% |
| Yakama | 0.0 /100 | #337 | Tragic 18.3% |
| Immigrants | Cabo Verde | 0.0 /100 | #338 | Tragic 18.5% |
Demographics Similar to Spanish American Indians by Seniors Poverty Over the Age of 75
In terms of seniors poverty over the age of 75, the demographic groups most similar to Spanish American Indians are Bahamian (15.5%, a difference of 0.010%), Native/Alaskan (15.5%, a difference of 0.10%), Honduran (15.4%, a difference of 0.44%), Yuman (15.4%, a difference of 0.72%), and Immigrants from Latin America (15.6%, a difference of 0.79%).
| Demographics | Rating | Rank | Seniors Poverty Over the Age of 75 |
| Colville | 0.0 /100 | #292 | Tragic 15.2% |
| Apache | 0.0 /100 | #293 | Tragic 15.3% |
| Immigrants | Jamaica | 0.0 /100 | #294 | Tragic 15.3% |
| U.S. Virgin Islanders | 0.0 /100 | #295 | Tragic 15.4% |
| Yuman | 0.0 /100 | #296 | Tragic 15.4% |
| Hondurans | 0.0 /100 | #297 | Tragic 15.4% |
| Natives/Alaskans | 0.0 /100 | #298 | Tragic 15.5% |
| Spanish American Indians | 0.0 /100 | #299 | Tragic 15.5% |
| Bahamians | 0.0 /100 | #300 | Tragic 15.5% |
| Immigrants | Latin America | 0.0 /100 | #301 | Tragic 15.6% |
| West Indians | 0.0 /100 | #302 | Tragic 15.7% |
| Immigrants | Honduras | 0.0 /100 | #303 | Tragic 15.7% |
| Immigrants | Trinidad and Tobago | 0.0 /100 | #304 | Tragic 15.7% |
| Ecuadorians | 0.0 /100 | #305 | Tragic 15.7% |
| Hispanics or Latinos | 0.0 /100 | #306 | Tragic 15.8% |