Swiss vs Immigrants from North Macedonia Seniors Poverty Over the Age of 75
COMPARE
Swiss
Immigrants from North Macedonia
Seniors Poverty Over the Age of 75
Seniors Poverty Over the Age of 75 Comparison
Swiss
Immigrants from North Macedonia
10.7%
SENIORS POVERTY OVER THE AGE OF 75
99.7/ 100
METRIC RATING
30th/ 347
METRIC RANK
11.1%
SENIORS POVERTY OVER THE AGE OF 75
98.6/ 100
METRIC RATING
51st/ 347
METRIC RANK
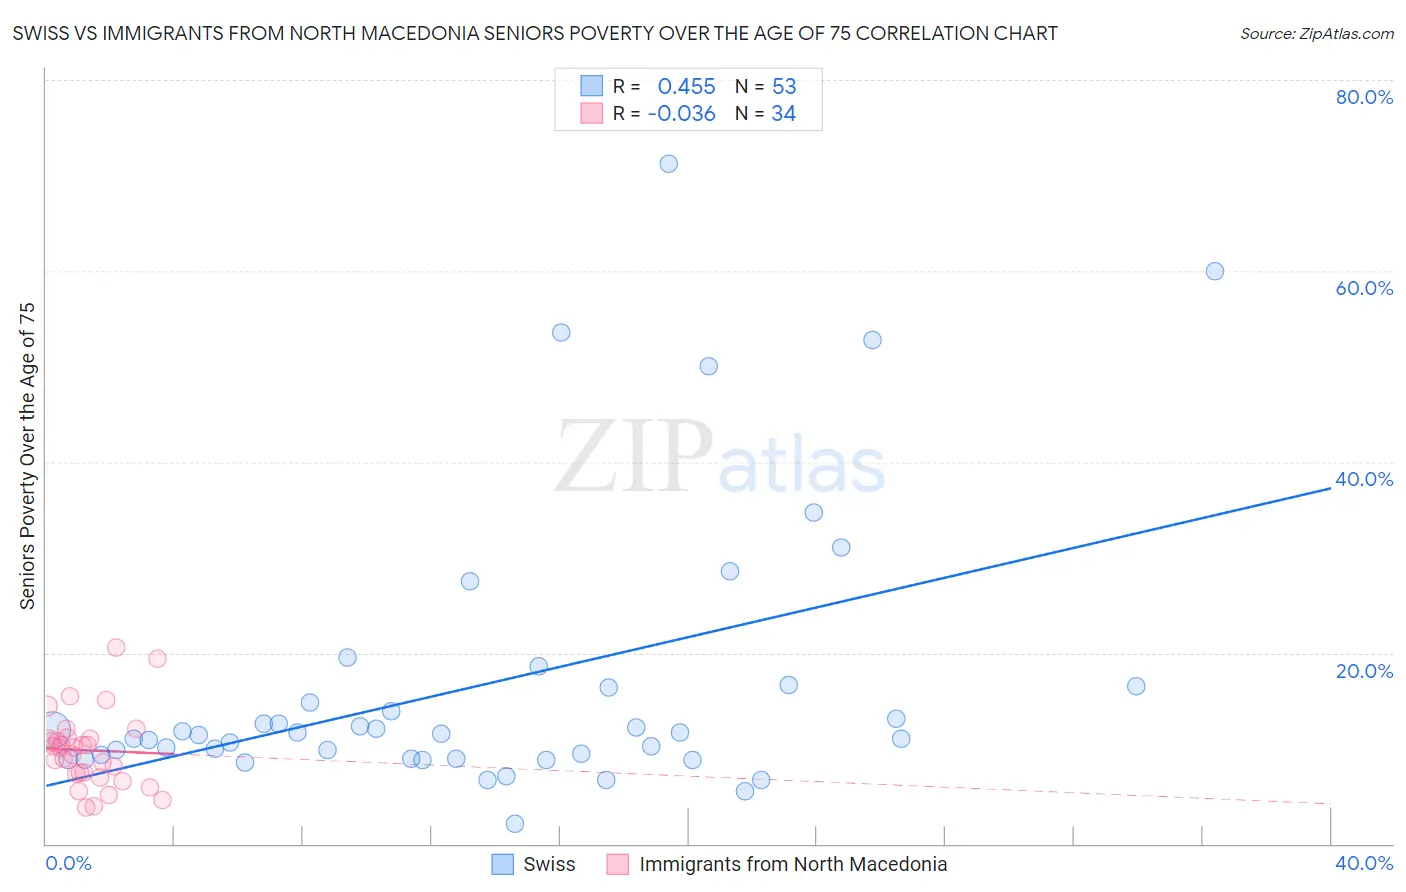
Swiss vs Immigrants from North Macedonia Seniors Poverty Over the Age of 75 Correlation Chart
The statistical analysis conducted on geographies consisting of 456,866,168 people shows a moderate positive correlation between the proportion of Swiss and poverty level among seniors over the age of 75 in the United States with a correlation coefficient (R) of 0.455 and weighted average of 10.7%. Similarly, the statistical analysis conducted on geographies consisting of 74,053,541 people shows no correlation between the proportion of Immigrants from North Macedonia and poverty level among seniors over the age of 75 in the United States with a correlation coefficient (R) of -0.036 and weighted average of 11.1%, a difference of 4.0%.
Seniors Poverty Over the Age of 75 Correlation Summary
| Measurement | Swiss | Immigrants from North Macedonia |
| Minimum | 2.1% | 3.8% |
| Maximum | 71.2% | 20.6% |
| Range | 69.1% | 16.7% |
| Mean | 16.7% | 9.8% |
| Median | 11.5% | 10.1% |
| Interquartile 25% (IQ1) | 8.9% | 7.3% |
| Interquartile 75% (IQ3) | 16.4% | 11.0% |
| Interquartile Range (IQR) | 7.5% | 3.7% |
| Standard Deviation (Sample) | 14.8% | 3.9% |
| Standard Deviation (Population) | 14.7% | 3.8% |
Similar Demographics by Seniors Poverty Over the Age of 75
Demographics Similar to Swiss by Seniors Poverty Over the Age of 75
In terms of seniors poverty over the age of 75, the demographic groups most similar to Swiss are Assyrian/Chaldean/Syriac (10.7%, a difference of 0.080%), Marshallese (10.7%, a difference of 0.19%), Irish (10.7%, a difference of 0.23%), Northern European (10.7%, a difference of 0.29%), and British (10.7%, a difference of 0.32%).
| Demographics | Rating | Rank | Seniors Poverty Over the Age of 75 |
| Lithuanians | 99.8 /100 | #23 | Exceptional 10.6% |
| Poles | 99.8 /100 | #24 | Exceptional 10.6% |
| Menominee | 99.8 /100 | #25 | Exceptional 10.6% |
| Bulgarians | 99.8 /100 | #26 | Exceptional 10.7% |
| Northern Europeans | 99.8 /100 | #27 | Exceptional 10.7% |
| Irish | 99.8 /100 | #28 | Exceptional 10.7% |
| Assyrians/Chaldeans/Syriacs | 99.8 /100 | #29 | Exceptional 10.7% |
| Swiss | 99.7 /100 | #30 | Exceptional 10.7% |
| Marshallese | 99.7 /100 | #31 | Exceptional 10.7% |
| British | 99.7 /100 | #32 | Exceptional 10.7% |
| Puget Sound Salish | 99.7 /100 | #33 | Exceptional 10.8% |
| Italians | 99.7 /100 | #34 | Exceptional 10.8% |
| Luxembourgers | 99.6 /100 | #35 | Exceptional 10.8% |
| Scotch-Irish | 99.6 /100 | #36 | Exceptional 10.8% |
| Latvians | 99.6 /100 | #37 | Exceptional 10.8% |
Demographics Similar to Immigrants from North Macedonia by Seniors Poverty Over the Age of 75
In terms of seniors poverty over the age of 75, the demographic groups most similar to Immigrants from North Macedonia are Serbian (11.1%, a difference of 0.030%), Samoan (11.1%, a difference of 0.14%), Zimbabwean (11.2%, a difference of 0.16%), Immigrants from England (11.2%, a difference of 0.22%), and French (11.1%, a difference of 0.25%).
| Demographics | Rating | Rank | Seniors Poverty Over the Age of 75 |
| Belgians | 99.1 /100 | #44 | Exceptional 11.0% |
| Carpatho Rusyns | 99.0 /100 | #45 | Exceptional 11.1% |
| Greeks | 99.0 /100 | #46 | Exceptional 11.1% |
| Hawaiians | 98.8 /100 | #47 | Exceptional 11.1% |
| French | 98.7 /100 | #48 | Exceptional 11.1% |
| Samoans | 98.7 /100 | #49 | Exceptional 11.1% |
| Serbians | 98.6 /100 | #50 | Exceptional 11.1% |
| Immigrants | North Macedonia | 98.6 /100 | #51 | Exceptional 11.1% |
| Zimbabweans | 98.5 /100 | #52 | Exceptional 11.2% |
| Immigrants | England | 98.4 /100 | #53 | Exceptional 11.2% |
| Afghans | 98.2 /100 | #54 | Exceptional 11.2% |
| Hungarians | 98.1 /100 | #55 | Exceptional 11.2% |
| Slavs | 98.1 /100 | #56 | Exceptional 11.2% |
| Immigrants | Canada | 97.9 /100 | #57 | Exceptional 11.2% |
| Yugoslavians | 97.9 /100 | #58 | Exceptional 11.2% |