Scottish vs Immigrants from Eastern Africa Female Poverty Among 18-24 Year Olds
COMPARE
Scottish
Immigrants from Eastern Africa
Female Poverty Among 18-24 Year Olds
Female Poverty Among 18-24 Year Olds Comparison
Scottish
Immigrants from Eastern Africa
20.9%
FEMALE POVERTY AMONG 18-24 YEAR OLDS
4.5/ 100
METRIC RATING
237th/ 347
METRIC RANK
21.4%
FEMALE POVERTY AMONG 18-24 YEAR OLDS
0.4/ 100
METRIC RATING
262nd/ 347
METRIC RANK
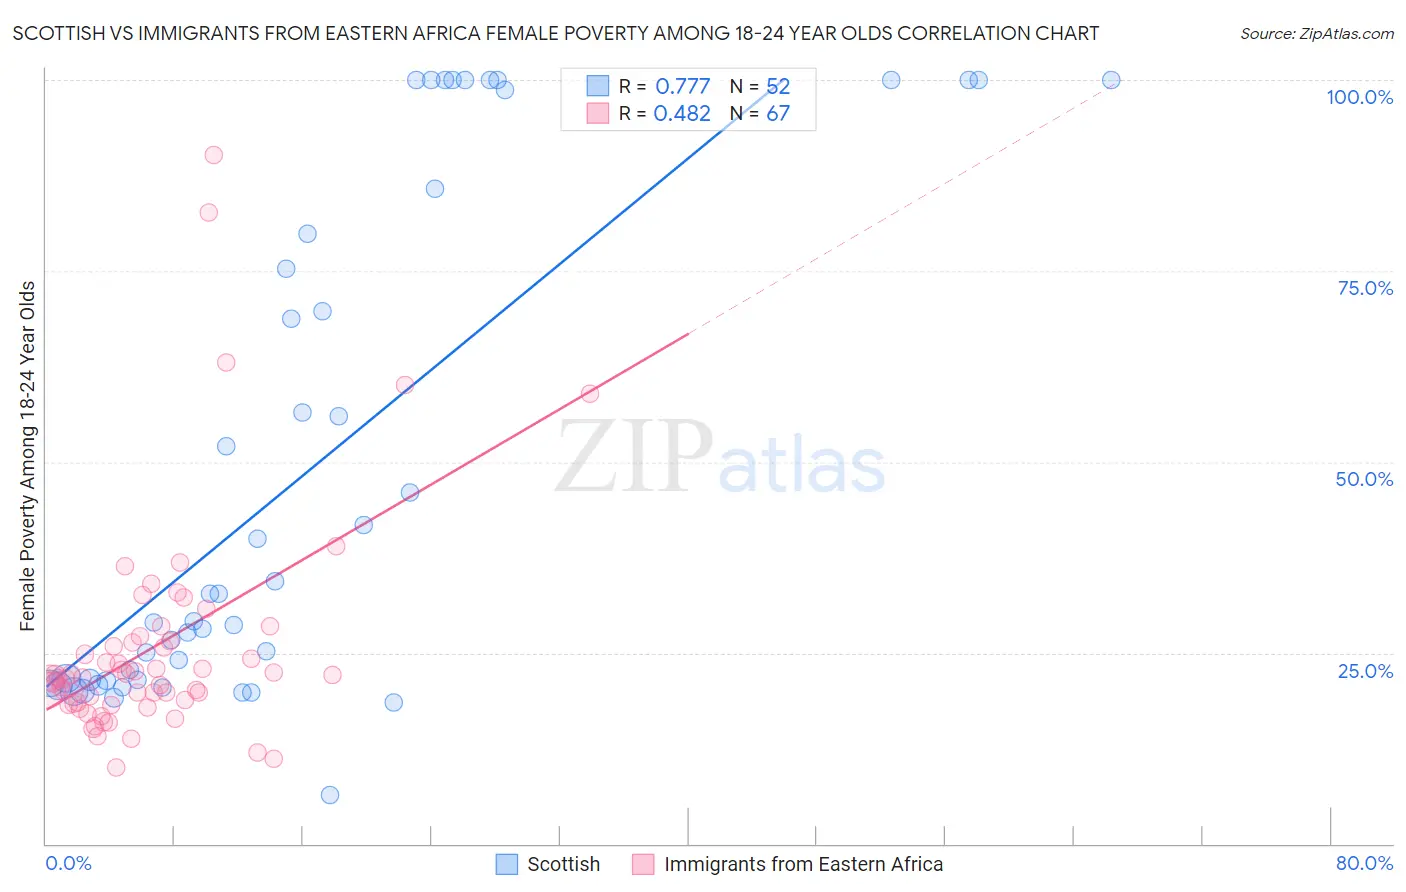
Scottish vs Immigrants from Eastern Africa Female Poverty Among 18-24 Year Olds Correlation Chart
The statistical analysis conducted on geographies consisting of 532,782,513 people shows a strong positive correlation between the proportion of Scottish and poverty level among females between the ages 18 and 24 in the United States with a correlation coefficient (R) of 0.777 and weighted average of 20.9%. Similarly, the statistical analysis conducted on geographies consisting of 348,760,216 people shows a moderate positive correlation between the proportion of Immigrants from Eastern Africa and poverty level among females between the ages 18 and 24 in the United States with a correlation coefficient (R) of 0.482 and weighted average of 21.4%, a difference of 2.8%.
Female Poverty Among 18-24 Year Olds Correlation Summary
| Measurement | Scottish | Immigrants from Eastern Africa |
| Minimum | 6.3% | 10.0% |
| Maximum | 100.0% | 90.2% |
| Range | 93.7% | 80.3% |
| Mean | 49.0% | 25.8% |
| Median | 30.9% | 21.8% |
| Interquartile 25% (IQ1) | 21.4% | 18.4% |
| Interquartile 75% (IQ3) | 82.8% | 26.5% |
| Interquartile Range (IQR) | 61.4% | 8.1% |
| Standard Deviation (Sample) | 32.8% | 14.7% |
| Standard Deviation (Population) | 32.5% | 14.6% |
Similar Demographics by Female Poverty Among 18-24 Year Olds
Demographics Similar to Scottish by Female Poverty Among 18-24 Year Olds
In terms of female poverty among 18-24 year olds, the demographic groups most similar to Scottish are Immigrants from Singapore (20.9%, a difference of 0.040%), Immigrants from Guatemala (20.9%, a difference of 0.050%), Luxembourger (20.9%, a difference of 0.070%), Immigrants from Eritrea (20.9%, a difference of 0.090%), and Okinawan (20.8%, a difference of 0.10%).
| Demographics | Rating | Rank | Female Poverty Among 18-24 Year Olds |
| Whites/Caucasians | 6.1 /100 | #230 | Tragic 20.8% |
| Immigrants | St. Vincent and the Grenadines | 6.0 /100 | #231 | Tragic 20.8% |
| Finns | 6.0 /100 | #232 | Tragic 20.8% |
| Immigrants | Denmark | 5.8 /100 | #233 | Tragic 20.8% |
| Welsh | 5.4 /100 | #234 | Tragic 20.8% |
| Immigrants | Uganda | 5.1 /100 | #235 | Tragic 20.8% |
| Okinawans | 4.9 /100 | #236 | Tragic 20.8% |
| Scottish | 4.5 /100 | #237 | Tragic 20.9% |
| Immigrants | Singapore | 4.4 /100 | #238 | Tragic 20.9% |
| Immigrants | Guatemala | 4.3 /100 | #239 | Tragic 20.9% |
| Luxembourgers | 4.2 /100 | #240 | Tragic 20.9% |
| Immigrants | Eritrea | 4.2 /100 | #241 | Tragic 20.9% |
| Israelis | 4.1 /100 | #242 | Tragic 20.9% |
| Marshallese | 3.4 /100 | #243 | Tragic 20.9% |
| Immigrants | Thailand | 3.4 /100 | #244 | Tragic 20.9% |
Demographics Similar to Immigrants from Eastern Africa by Female Poverty Among 18-24 Year Olds
In terms of female poverty among 18-24 year olds, the demographic groups most similar to Immigrants from Eastern Africa are Immigrants from Bahamas (21.4%, a difference of 0.20%), Immigrants from Norway (21.4%, a difference of 0.26%), Immigrants from France (21.4%, a difference of 0.31%), Vietnamese (21.4%, a difference of 0.34%), and Icelander (21.5%, a difference of 0.35%).
| Demographics | Rating | Rank | Female Poverty Among 18-24 Year Olds |
| Immigrants | Grenada | 1.2 /100 | #255 | Tragic 21.2% |
| Tsimshian | 1.0 /100 | #256 | Tragic 21.2% |
| Taiwanese | 1.0 /100 | #257 | Tragic 21.2% |
| Vietnamese | 0.6 /100 | #258 | Tragic 21.4% |
| Immigrants | France | 0.6 /100 | #259 | Tragic 21.4% |
| Immigrants | Norway | 0.6 /100 | #260 | Tragic 21.4% |
| Immigrants | Bahamas | 0.5 /100 | #261 | Tragic 21.4% |
| Immigrants | Eastern Africa | 0.4 /100 | #262 | Tragic 21.4% |
| Icelanders | 0.3 /100 | #263 | Tragic 21.5% |
| Hondurans | 0.3 /100 | #264 | Tragic 21.5% |
| Immigrants | Nonimmigrants | 0.3 /100 | #265 | Tragic 21.5% |
| Alaska Natives | 0.3 /100 | #266 | Tragic 21.5% |
| Americans | 0.3 /100 | #267 | Tragic 21.6% |
| Immigrants | Burma/Myanmar | 0.2 /100 | #268 | Tragic 21.6% |
| Celtics | 0.2 /100 | #269 | Tragic 21.6% |