Lumbee vs Nigerian Female Poverty Among 25-34 Year Olds
COMPARE
Lumbee
Nigerian
Female Poverty Among 25-34 Year Olds
Female Poverty Among 25-34 Year Olds Comparison
Lumbee
Nigerians
26.3%
FEMALE POVERTY AMONG 25-34 YEAR OLDS
0.0/ 100
METRIC RATING
346th/ 347
METRIC RANK
14.4%
FEMALE POVERTY AMONG 25-34 YEAR OLDS
4.2/ 100
METRIC RATING
223rd/ 347
METRIC RANK
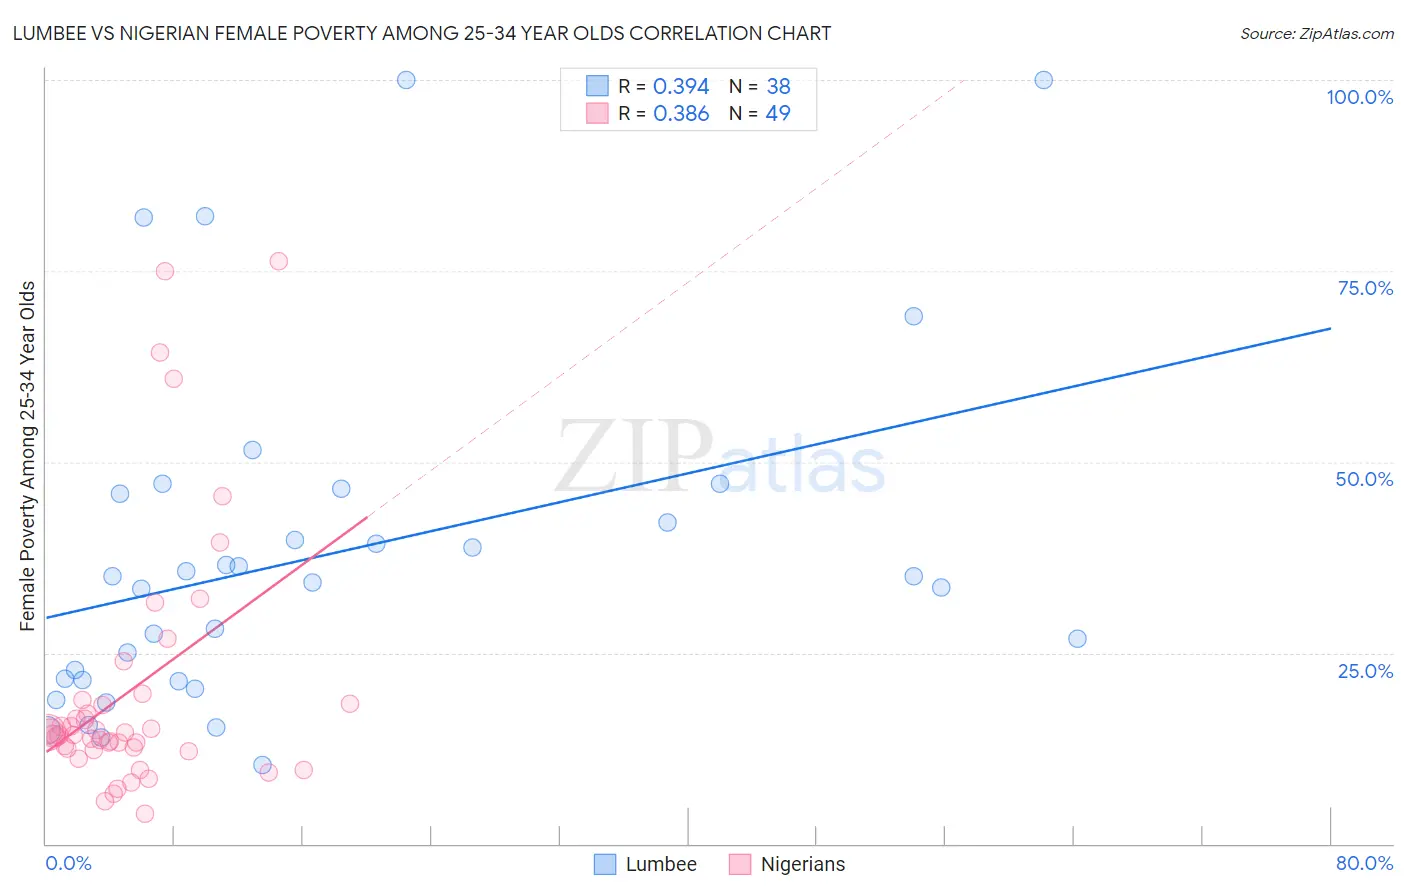
Lumbee vs Nigerian Female Poverty Among 25-34 Year Olds Correlation Chart
The statistical analysis conducted on geographies consisting of 91,764,712 people shows a mild positive correlation between the proportion of Lumbee and poverty level among females between the ages 25 and 34 in the United States with a correlation coefficient (R) of 0.394 and weighted average of 26.3%. Similarly, the statistical analysis conducted on geographies consisting of 329,631,397 people shows a mild positive correlation between the proportion of Nigerians and poverty level among females between the ages 25 and 34 in the United States with a correlation coefficient (R) of 0.386 and weighted average of 14.4%, a difference of 82.3%.
Female Poverty Among 25-34 Year Olds Correlation Summary
| Measurement | Lumbee | Nigerian |
| Minimum | 10.3% | 4.0% |
| Maximum | 100.0% | 76.3% |
| Range | 89.7% | 72.3% |
| Mean | 37.7% | 20.1% |
| Median | 34.5% | 14.2% |
| Interquartile 25% (IQ1) | 21.5% | 12.3% |
| Interquartile 75% (IQ3) | 45.8% | 18.6% |
| Interquartile Range (IQR) | 24.3% | 6.2% |
| Standard Deviation (Sample) | 22.5% | 16.8% |
| Standard Deviation (Population) | 22.2% | 16.7% |
Similar Demographics by Female Poverty Among 25-34 Year Olds
Demographics Similar to Lumbee by Female Poverty Among 25-34 Year Olds
In terms of female poverty among 25-34 year olds, the demographic groups most similar to Lumbee are Puerto Rican (26.3%, a difference of 0.030%), Pima (25.3%, a difference of 3.9%), Tohono O'odham (24.7%, a difference of 6.2%), Yup'ik (24.3%, a difference of 8.1%), and Hopi (23.7%, a difference of 11.0%).
| Demographics | Rating | Rank | Female Poverty Among 25-34 Year Olds |
| Cajuns | 0.0 /100 | #333 | Tragic 19.9% |
| Apache | 0.0 /100 | #334 | Tragic 20.1% |
| Natives/Alaskans | 0.0 /100 | #335 | Tragic 20.3% |
| Pueblo | 0.0 /100 | #336 | Tragic 22.2% |
| Crow | 0.0 /100 | #337 | Tragic 22.7% |
| Houma | 0.0 /100 | #338 | Tragic 22.7% |
| Yuman | 0.0 /100 | #339 | Tragic 22.9% |
| Sioux | 0.0 /100 | #340 | Tragic 23.0% |
| Navajo | 0.0 /100 | #341 | Tragic 23.3% |
| Hopi | 0.0 /100 | #342 | Tragic 23.7% |
| Yup'ik | 0.0 /100 | #343 | Tragic 24.3% |
| Tohono O'odham | 0.0 /100 | #344 | Tragic 24.7% |
| Pima | 0.0 /100 | #345 | Tragic 25.3% |
| Lumbee | 0.0 /100 | #346 | Tragic 26.3% |
| Puerto Ricans | 0.0 /100 | #347 | Tragic 26.3% |
Demographics Similar to Nigerians by Female Poverty Among 25-34 Year Olds
In terms of female poverty among 25-34 year olds, the demographic groups most similar to Nigerians are Immigrants from Portugal (14.4%, a difference of 0.060%), Immigrants from Sudan (14.4%, a difference of 0.070%), Sudanese (14.4%, a difference of 0.13%), Ghanaian (14.4%, a difference of 0.29%), and Immigrants from Barbados (14.5%, a difference of 0.39%).
| Demographics | Rating | Rank | Female Poverty Among 25-34 Year Olds |
| French Canadians | 5.5 /100 | #216 | Tragic 14.3% |
| Spanish American Indians | 5.5 /100 | #217 | Tragic 14.3% |
| Immigrants | Thailand | 5.2 /100 | #218 | Tragic 14.3% |
| Ecuadorians | 5.2 /100 | #219 | Tragic 14.3% |
| Ghanaians | 4.8 /100 | #220 | Tragic 14.4% |
| Sudanese | 4.4 /100 | #221 | Tragic 14.4% |
| Immigrants | Portugal | 4.3 /100 | #222 | Tragic 14.4% |
| Nigerians | 4.2 /100 | #223 | Tragic 14.4% |
| Immigrants | Sudan | 4.0 /100 | #224 | Tragic 14.4% |
| Immigrants | Barbados | 3.4 /100 | #225 | Tragic 14.5% |
| Nicaraguans | 3.3 /100 | #226 | Tragic 14.5% |
| Celtics | 2.8 /100 | #227 | Tragic 14.5% |
| Vietnamese | 2.6 /100 | #228 | Tragic 14.6% |
| Spanish | 2.5 /100 | #229 | Tragic 14.6% |
| Spaniards | 2.3 /100 | #230 | Tragic 14.6% |