Swedish vs Immigrants from Grenada Male Poverty

COMPARE

Swedish
Race
Ancestry
AfghanAfricanAlaska NativeAlaskan AthabascanAlbanianAleutAlsatianAmericanApacheArabArapahoArgentineanArmenianAssyrian/Chaldean/SyriacAustralianAustrianBahamianBangladeshiBarbadianBasqueBelgianBelizeanBermudanBhutaneseBlackfeetBolivianBrazilianBritishBritish West IndianBulgarianBurmeseCajunCambodianCanadianCape VerdeanCarpatho RusynCelticCentral AmericanCentral American IndianCherokeeCheyenneChickasawChileanChineseChippewaChoctawColombianColvilleComancheCosta RicanCreeCreekCroatianCrowCubanCypriotCzechCzechoslovakianDanishDelawareDominicanDutchDutch West IndianEastern EuropeanEcuadorianEgyptianEnglishEstonianEthiopianEuropeanFijianFilipinoFinnishFrenchFrench American IndianFrench CanadianGermanGerman RussianGhanaianGreekGuamanian/ChamorroGuatemalanGuyaneseHaitianHmongHonduranHopiHoumaHungarianIcelanderIndian (Asian)IndonesianInupiatIranianIraqiIrishIroquoisIsraeliItalianJamaicanJapaneseJordanianKenyanKiowaKoreanLaotianLatvianLebaneseLiberianLithuanianLumbeeLuxembourgerMacedonianMalaysianMalteseMarshalleseMenomineeMexicanMexican American IndianMongolianMoroccanNative HawaiianNavajoNepaleseNew ZealanderNicaraguanNigerianNorthern EuropeanNorwegianOkinawanOsageOttawaPaiutePakistaniPalestinianPanamanianParaguayanPennsylvania GermanPeruvianPimaPolishPortuguesePotawatomiPuebloPuerto RicanPuget Sound SalishRomanianRussianSalvadoranSamoanScandinavianScotch-IrishScottishSeminoleSenegaleseSerbianShoshoneSierra LeoneanSiouxSlavicSlovakSloveneSomaliSouth AfricanSouth AmericanSouth American IndianSoviet UnionSpaniardSpanishSpanish AmericanSpanish American IndianSri LankanSubsaharan AfricanSudaneseSwedishSwissSyrianTaiwaneseThaiTlingit-HaidaTohono O'OdhamTonganTrinidadian and TobagonianTsimshianTurkishU.S. Virgin IslanderUgandanUkrainianUruguayanUteVenezuelanVietnameseWelshWest IndianYakamaYaquiYugoslavianYumanYup'ikZimbabwean
Immigration
NonimmigrantsImmigrantsAfghanistanAfricaAlbaniaArgentinaArmeniaAsiaAustraliaAustriaBahamasBangladeshBarbadosBelarusBelgiumBelizeBoliviaBosnia and HerzegovinaBrazilBulgariaBurma/MyanmarCabo VerdeCambodiaCameroonCanadaCaribbeanCentral AmericaChileChinaColombiaCongoCosta RicaCroatiaCubaCzechoslovakiaDenmarkDominicaDominican RepublicEastern AfricaEastern AsiaEastern EuropeEcuadorEgyptEl SalvadorEnglandEritreaEthiopiaEuropeFijiFranceGermanyGhanaGreeceGuatemalaGuyanaHaitiHondurasHong KongHungaryIndiaIndonesiaIranIraqIrelandIsraelItalyJamaicaJapanJordanKazakhstanKenyaKoreaKuwaitLaosLatin AmericaLatviaLebanonLiberiaLithuaniaMalaysiaMexicoMicronesiaMiddle AfricaMoldovaMoroccoNepalNetherlandsNicaraguaNigeriaNorth AmericaNorth MacedoniaNorthern AfricaNorthern EuropeNorwayOceaniaPakistanPanamaPeruPhilippinesPolandPortugalRomaniaRussiaSaudi ArabiaScotlandSenegalSerbiaSierra LeoneSingaporeSomaliaSouth AfricaSouth AmericaSouth Central AsiaSouth Eastern AsiaSouthern EuropeSpainSri LankaSt. Vincent and the GrenadinesSudanSwedenSwitzerlandSyriaTaiwanThailandTrinidad and TobagoTurkeyUgandaUkraineUruguayUzbekistanVenezuelaVietnamWest IndiesWestern AfricaWestern AsiaWestern EuropeYemenZaireZimbabweAzores
Immigrants from Grenada
Race
Ancestry
AfghanAfricanAlaska NativeAlaskan AthabascanAlbanianAleutAlsatianAmericanApacheArabArapahoArgentineanArmenianAssyrian/Chaldean/SyriacAustralianAustrianBahamianBangladeshiBarbadianBasqueBelgianBelizeanBermudanBhutaneseBlackfeetBolivianBrazilianBritishBritish West IndianBulgarianBurmeseCajunCambodianCanadianCape VerdeanCarpatho RusynCelticCentral AmericanCentral American IndianCherokeeCheyenneChickasawChileanChineseChippewaChoctawColombianColvilleComancheCosta RicanCreeCreekCroatianCrowCubanCypriotCzechCzechoslovakianDanishDelawareDominicanDutchDutch West IndianEastern EuropeanEcuadorianEgyptianEnglishEstonianEthiopianEuropeanFijianFilipinoFinnishFrenchFrench American IndianFrench CanadianGermanGerman RussianGhanaianGreekGuamanian/ChamorroGuatemalanGuyaneseHaitianHmongHonduranHopiHoumaHungarianIcelanderIndian (Asian)IndonesianInupiatIranianIraqiIrishIroquoisIsraeliItalianJamaicanJapaneseJordanianKenyanKiowaKoreanLaotianLatvianLebaneseLiberianLithuanianLumbeeLuxembourgerMacedonianMalaysianMalteseMarshalleseMenomineeMexicanMexican American IndianMongolianMoroccanNative HawaiianNavajoNepaleseNew ZealanderNicaraguanNigerianNorthern EuropeanNorwegianOkinawanOsageOttawaPaiutePakistaniPalestinianPanamanianParaguayanPennsylvania GermanPeruvianPimaPolishPortuguesePotawatomiPuebloPuerto RicanPuget Sound SalishRomanianRussianSalvadoranSamoanScandinavianScotch-IrishScottishSeminoleSenegaleseSerbianShoshoneSierra LeoneanSiouxSlavicSlovakSloveneSomaliSouth AfricanSouth AmericanSouth American IndianSoviet UnionSpaniardSpanishSpanish AmericanSpanish American IndianSri LankanSubsaharan AfricanSudaneseSwissSyrianTaiwaneseThaiTlingit-HaidaTohono O'OdhamTonganTrinidadian and TobagonianTsimshianTurkishU.S. Virgin IslanderUgandanUkrainianUruguayanUteVenezuelanVietnameseWelshWest IndianYakamaYaquiYugoslavianYumanYup'ikZimbabwean
Immigration
NonimmigrantsImmigrantsAfghanistanAfricaAlbaniaArgentinaArmeniaAsiaAustraliaAustriaBahamasBangladeshBarbadosBelarusBelgiumBelizeBoliviaBosnia and HerzegovinaBrazilBulgariaBurma/MyanmarCabo VerdeCambodiaCameroonCanadaCaribbeanCentral AmericaChileChinaColombiaCongoCosta RicaCroatiaCubaCzechoslovakiaDenmarkDominicaDominican RepublicEastern AfricaEastern AsiaEastern EuropeEcuadorEgyptEl SalvadorEnglandEritreaEthiopiaEuropeFijiFranceGermanyGhanaGreeceGrenadaGuatemalaGuyanaHaitiHondurasHong KongHungaryIndiaIndonesiaIranIraqIrelandIsraelItalyJamaicaJapanJordanKazakhstanKenyaKoreaKuwaitLaosLatin AmericaLatviaLebanonLiberiaLithuaniaMalaysiaMexicoMicronesiaMiddle AfricaMoldovaMoroccoNepalNetherlandsNicaraguaNigeriaNorth AmericaNorth MacedoniaNorthern AfricaNorthern EuropeNorwayOceaniaPakistanPanamaPeruPhilippinesPolandPortugalRomaniaRussiaSaudi ArabiaScotlandSenegalSerbiaSierra LeoneSingaporeSomaliaSouth AfricaSouth AmericaSouth Central AsiaSouth Eastern AsiaSouthern EuropeSpainSri LankaSt. Vincent and the GrenadinesSudanSwedenSwitzerlandSyriaTaiwanThailandTrinidad and TobagoTurkeyUgandaUkraineUruguayUzbekistanVenezuelaVietnamWest IndiesWestern AfricaWestern AsiaWestern EuropeYemenZaireZimbabweAzores
Male Poverty
Income
Poverty
Unemployment
Labor Participation
Family Structure
Vehicle Availability
Education Level
Disability

Male Poverty Comparison

Swedes

Immigrants from Grenada

Exceptional
Tragic
9.6%
MALE POVERTY
99.7/ 100
METRIC RATING
24th/ 347
METRIC RANK
14.7%
MALE POVERTY
0.0/ 100
METRIC RATING
318th/ 347
METRIC RANK

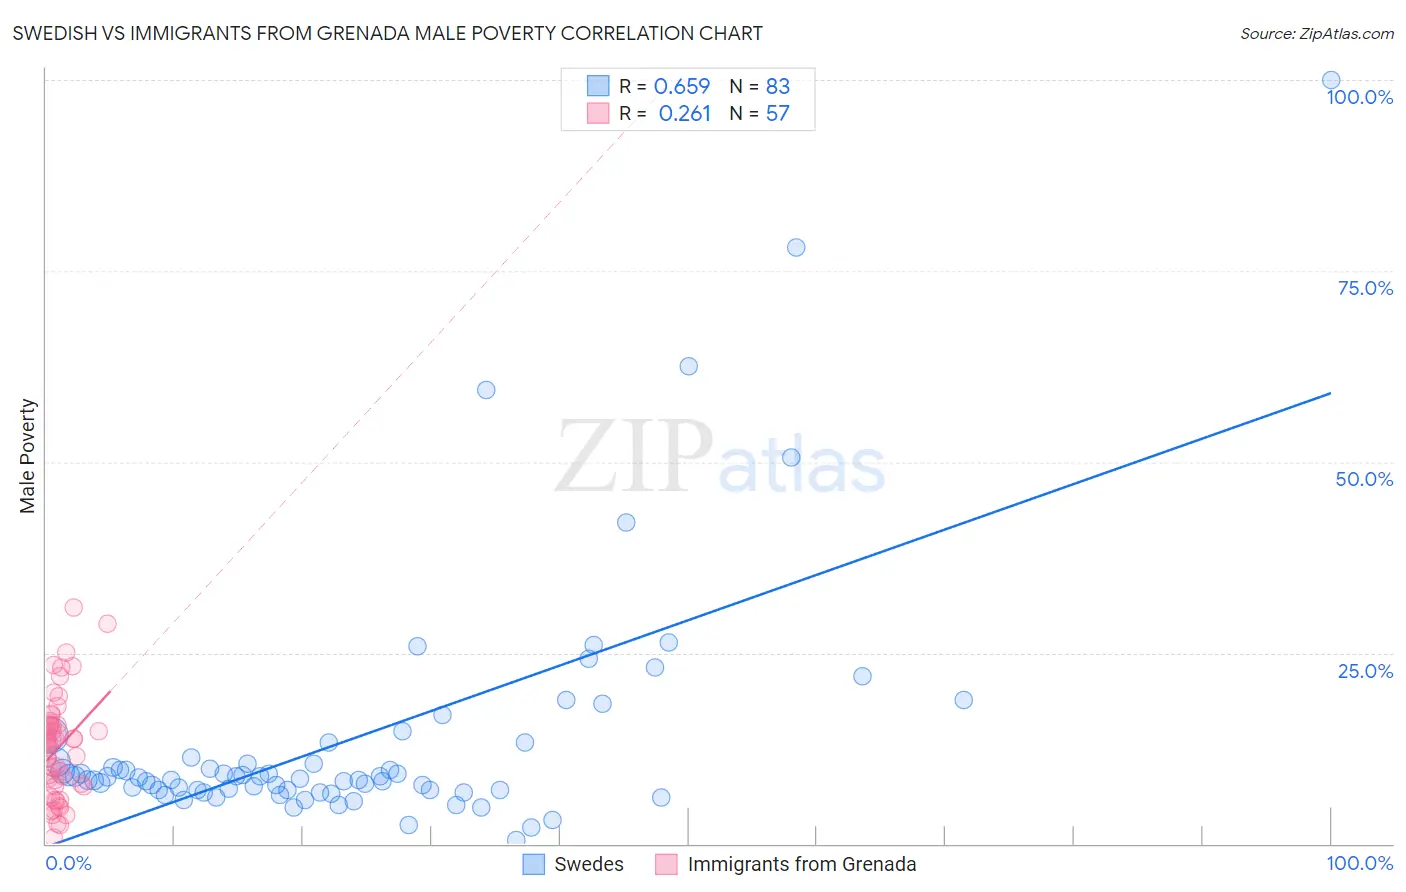
Swedish vs Immigrants from Grenada Male Poverty Correlation Chart

The statistical analysis conducted on geographies consisting of 538,008,774 people shows a significant positive correlation between the proportion of Swedes and poverty level among males in the United States with a correlation coefficient (R) of 0.659 and weighted average of 9.6%. Similarly, the statistical analysis conducted on geographies consisting of 67,181,242 people shows a weak positive correlation between the proportion of Immigrants from Grenada and poverty level among males in the United States with a correlation coefficient (R) of 0.261 and weighted average of 14.7%, a difference of 52.8%.
Swedish vs Immigrants from Grenada Male Poverty

Male Poverty Correlation Summary

MeasurementSwedishImmigrants from Grenada
Minimum0.53%0.80%
Maximum100.0%30.9%
Range99.5%30.1%
Mean13.8%12.6%
Median8.6%13.2%
Interquartile 25% (IQ1)7.0%7.5%
Interquartile 75% (IQ3)11.3%15.6%
Interquartile Range (IQR)4.3%8.1%
Standard Deviation (Sample)16.3%6.7%
Standard Deviation (Population)16.2%6.7%

Similar Demographics by Male Poverty

Demographics Similar to Swedes by Male Poverty

In terms of male poverty, the demographic groups most similar to Swedes are Italian (9.6%, a difference of 0.080%), Croatian (9.6%, a difference of 0.090%), Eastern European (9.6%, a difference of 0.14%), Immigrants from Scotland (9.6%, a difference of 0.34%), and Burmese (9.7%, a difference of 0.58%).
DemographicsRating | RankMale Poverty
Norwegians
99.8
/100
|
#17
Exceptional
9.5%
Lithuanians
99.8
/100
|
#18
Exceptional
9.5%
Immigrants | Hong Kong
99.7
/100
|
#19
Exceptional
9.6%
Latvians
99.7
/100
|
#20
Exceptional
9.6%
Immigrants | Scotland
99.7
/100
|
#21
Exceptional
9.6%
Croatians
99.7
/100
|
#22
Exceptional
9.6%
Italians
99.7
/100
|
#23
Exceptional
9.6%
Swedes
99.7
/100
|
#24
Exceptional
9.6%
Eastern Europeans
99.6
/100
|
#25
Exceptional
9.6%
Burmese
99.6
/100
|
#26
Exceptional
9.7%
Danes
99.6
/100
|
#27
Exceptional
9.7%
Immigrants | Korea
99.6
/100
|
#28
Exceptional
9.7%
Greeks
99.6
/100
|
#29
Exceptional
9.7%
Poles
99.5
/100
|
#30
Exceptional
9.7%
Tongans
99.5
/100
|
#31
Exceptional
9.7%

Demographics Similar to Immigrants from Grenada by Male Poverty

In terms of male poverty, the demographic groups most similar to Immigrants from Grenada are U.S. Virgin Islander (14.7%, a difference of 0.030%), Immigrants from Dominica (14.7%, a difference of 0.060%), Immigrants from Congo (14.7%, a difference of 0.12%), British West Indian (14.6%, a difference of 0.74%), and Chippewa (14.6%, a difference of 0.76%).
DemographicsRating | RankMale Poverty
Hondurans
0.0
/100
|
#311
Tragic
14.3%
Choctaw
0.0
/100
|
#312
Tragic
14.4%
Immigrants | Somalia
0.0
/100
|
#313
Tragic
14.6%
Immigrants | Honduras
0.0
/100
|
#314
Tragic
14.6%
Chippewa
0.0
/100
|
#315
Tragic
14.6%
British West Indians
0.0
/100
|
#316
Tragic
14.6%
Immigrants | Dominica
0.0
/100
|
#317
Tragic
14.7%
Immigrants | Grenada
0.0
/100
|
#318
Tragic
14.7%
U.S. Virgin Islanders
0.0
/100
|
#319
Tragic
14.7%
Immigrants | Congo
0.0
/100
|
#320
Tragic
14.7%
Arapaho
0.0
/100
|
#321
Tragic
15.1%
Kiowa
0.0
/100
|
#322
Tragic
15.2%
Colville
0.0
/100
|
#323
Tragic
15.2%
Menominee
0.0
/100
|
#324
Tragic
15.3%
Yakama
0.0
/100
|
#325
Tragic
15.3%