Sudanese vs Immigrants from Belarus Child Poverty Under the Age of 5
COMPARE
Sudanese
Immigrants from Belarus
Child Poverty Under the Age of 5
Child Poverty Under the Age of 5 Comparison
Sudanese
Immigrants from Belarus
19.3%
CHILD POVERTY UNDER THE AGE OF 5
0.9/ 100
METRIC RATING
233rd/ 347
METRIC RANK
14.7%
CHILD POVERTY UNDER THE AGE OF 5
99.7/ 100
METRIC RATING
41st/ 347
METRIC RANK
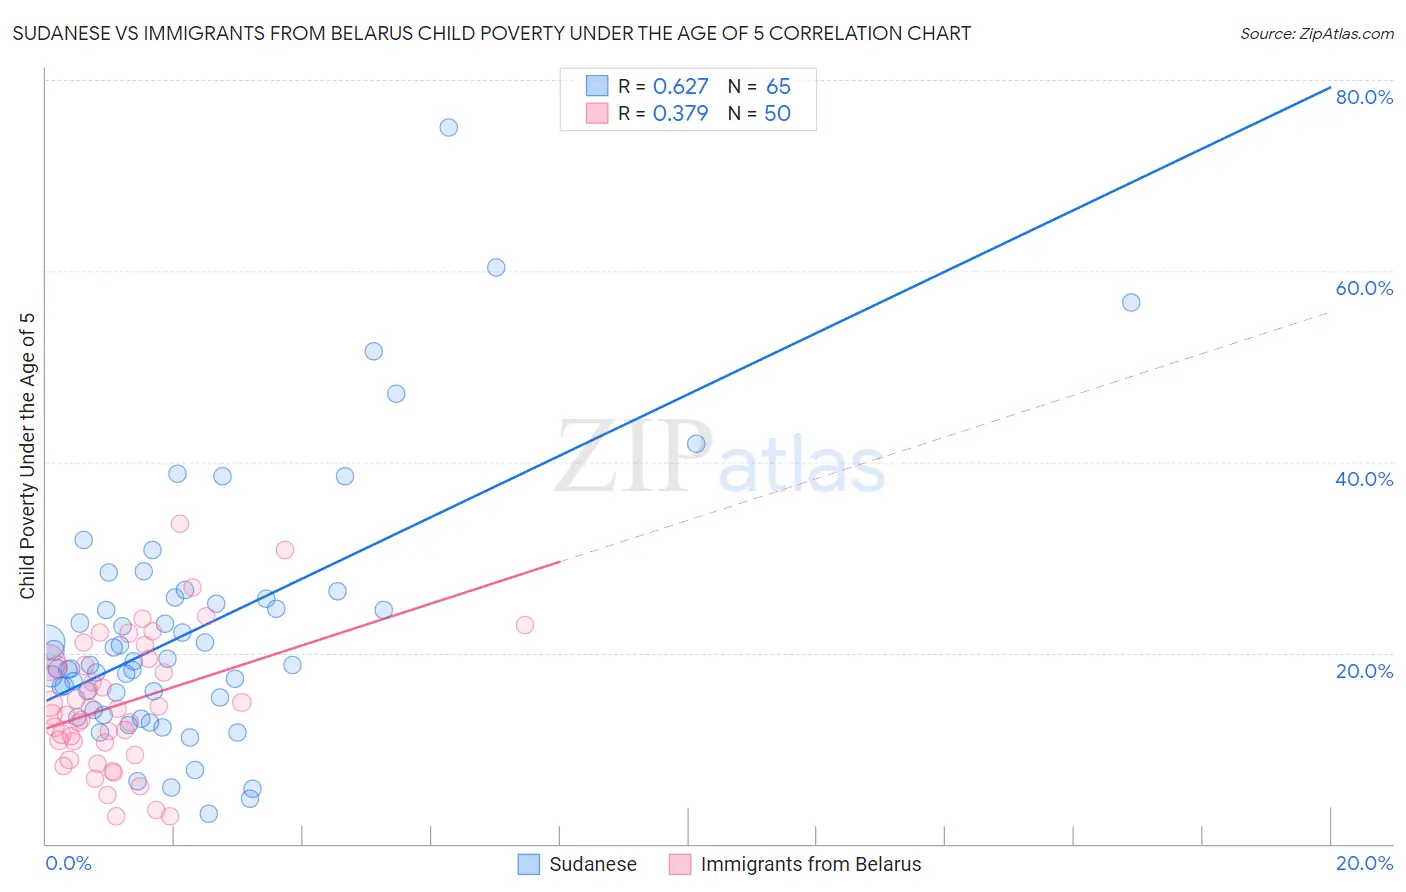
Sudanese vs Immigrants from Belarus Child Poverty Under the Age of 5 Correlation Chart
The statistical analysis conducted on geographies consisting of 109,330,527 people shows a significant positive correlation between the proportion of Sudanese and poverty level among children under the age of 5 in the United States with a correlation coefficient (R) of 0.627 and weighted average of 19.3%. Similarly, the statistical analysis conducted on geographies consisting of 145,813,526 people shows a mild positive correlation between the proportion of Immigrants from Belarus and poverty level among children under the age of 5 in the United States with a correlation coefficient (R) of 0.379 and weighted average of 14.7%, a difference of 31.9%.
Child Poverty Under the Age of 5 Correlation Summary
| Measurement | Sudanese | Immigrants from Belarus |
| Minimum | 3.1% | 2.8% |
| Maximum | 75.0% | 33.6% |
| Range | 71.9% | 30.8% |
| Mean | 22.4% | 14.7% |
| Median | 18.8% | 13.8% |
| Interquartile 25% (IQ1) | 14.6% | 10.7% |
| Interquartile 75% (IQ3) | 25.7% | 18.9% |
| Interquartile Range (IQR) | 11.1% | 8.3% |
| Standard Deviation (Sample) | 13.4% | 6.9% |
| Standard Deviation (Population) | 13.3% | 6.8% |
Similar Demographics by Child Poverty Under the Age of 5
Demographics Similar to Sudanese by Child Poverty Under the Age of 5
In terms of child poverty under the age of 5, the demographic groups most similar to Sudanese are Trinidadian and Tobagonian (19.3%, a difference of 0.060%), Immigrants from Micronesia (19.4%, a difference of 0.12%), Immigrants from Laos (19.4%, a difference of 0.33%), Immigrants from Trinidad and Tobago (19.4%, a difference of 0.34%), and Bermudan (19.2%, a difference of 0.62%).
| Demographics | Rating | Rank | Child Poverty Under the Age of 5 |
| Immigrants | Eritrea | 1.5 /100 | #226 | Tragic 19.1% |
| Cape Verdeans | 1.4 /100 | #227 | Tragic 19.1% |
| Immigrants | Sudan | 1.3 /100 | #228 | Tragic 19.2% |
| Ghanaians | 1.2 /100 | #229 | Tragic 19.2% |
| Ecuadorians | 1.2 /100 | #230 | Tragic 19.2% |
| Bermudans | 1.2 /100 | #231 | Tragic 19.2% |
| Trinidadians and Tobagonians | 0.9 /100 | #232 | Tragic 19.3% |
| Sudanese | 0.9 /100 | #233 | Tragic 19.3% |
| Immigrants | Micronesia | 0.9 /100 | #234 | Tragic 19.4% |
| Immigrants | Laos | 0.8 /100 | #235 | Tragic 19.4% |
| Immigrants | Trinidad and Tobago | 0.8 /100 | #236 | Tragic 19.4% |
| Immigrants | Cabo Verde | 0.6 /100 | #237 | Tragic 19.5% |
| Salvadorans | 0.6 /100 | #238 | Tragic 19.5% |
| Vietnamese | 0.6 /100 | #239 | Tragic 19.5% |
| Immigrants | Ecuador | 0.5 /100 | #240 | Tragic 19.6% |
Demographics Similar to Immigrants from Belarus by Child Poverty Under the Age of 5
In terms of child poverty under the age of 5, the demographic groups most similar to Immigrants from Belarus are Immigrants from Australia (14.6%, a difference of 0.12%), Soviet Union (14.7%, a difference of 0.16%), Immigrants from Greece (14.7%, a difference of 0.16%), Immigrants from Philippines (14.7%, a difference of 0.29%), and Eastern European (14.6%, a difference of 0.41%).
| Demographics | Rating | Rank | Child Poverty Under the Age of 5 |
| Immigrants | Moldova | 99.8 /100 | #34 | Exceptional 14.5% |
| Latvians | 99.8 /100 | #35 | Exceptional 14.5% |
| Maltese | 99.8 /100 | #36 | Exceptional 14.5% |
| Turks | 99.7 /100 | #37 | Exceptional 14.6% |
| Eastern Europeans | 99.7 /100 | #38 | Exceptional 14.6% |
| Norwegians | 99.7 /100 | #39 | Exceptional 14.6% |
| Immigrants | Australia | 99.7 /100 | #40 | Exceptional 14.6% |
| Immigrants | Belarus | 99.7 /100 | #41 | Exceptional 14.7% |
| Soviet Union | 99.7 /100 | #42 | Exceptional 14.7% |
| Immigrants | Greece | 99.7 /100 | #43 | Exceptional 14.7% |
| Immigrants | Philippines | 99.7 /100 | #44 | Exceptional 14.7% |
| Laotians | 99.6 /100 | #45 | Exceptional 14.7% |
| Tsimshian | 99.6 /100 | #46 | Exceptional 14.7% |
| Russians | 99.6 /100 | #47 | Exceptional 14.8% |
| Immigrants | Czechoslovakia | 99.6 /100 | #48 | Exceptional 14.8% |