Sri Lankan vs Immigrants from Bangladesh Child Poverty Among Boys Under 16
COMPARE
Sri Lankan
Immigrants from Bangladesh
Child Poverty Among Boys Under 16
Child Poverty Among Boys Under 16 Comparison
Sri Lankans
Immigrants from Bangladesh
14.9%
CHILD POVERTY AMONG BOYS UNDER 16
96.7/ 100
METRIC RATING
93rd/ 347
METRIC RANK
19.9%
CHILD POVERTY AMONG BOYS UNDER 16
0.0/ 100
METRIC RATING
274th/ 347
METRIC RANK
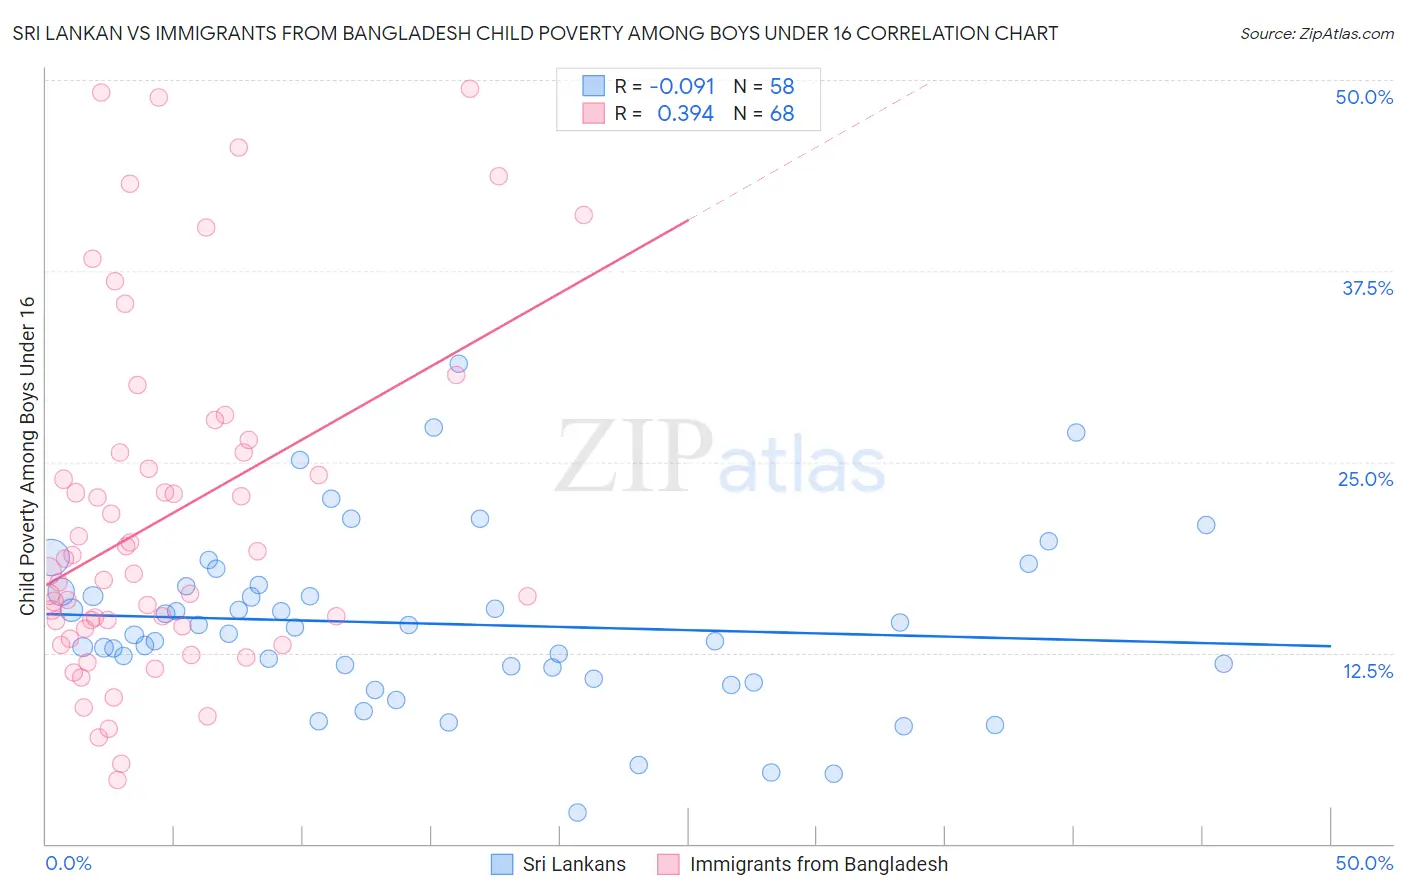
Sri Lankan vs Immigrants from Bangladesh Child Poverty Among Boys Under 16 Correlation Chart
The statistical analysis conducted on geographies consisting of 433,188,416 people shows a slight negative correlation between the proportion of Sri Lankans and poverty level among boys under the age of 16 in the United States with a correlation coefficient (R) of -0.091 and weighted average of 14.9%. Similarly, the statistical analysis conducted on geographies consisting of 202,330,281 people shows a mild positive correlation between the proportion of Immigrants from Bangladesh and poverty level among boys under the age of 16 in the United States with a correlation coefficient (R) of 0.394 and weighted average of 19.9%, a difference of 33.8%.
Child Poverty Among Boys Under 16 Correlation Summary
| Measurement | Sri Lankan | Immigrants from Bangladesh |
| Minimum | 2.0% | 4.2% |
| Maximum | 31.4% | 49.5% |
| Range | 29.4% | 45.3% |
| Mean | 14.4% | 21.3% |
| Median | 14.0% | 17.8% |
| Interquartile 25% (IQ1) | 11.6% | 14.1% |
| Interquartile 75% (IQ3) | 16.8% | 25.6% |
| Interquartile Range (IQR) | 5.3% | 11.4% |
| Standard Deviation (Sample) | 5.7% | 11.3% |
| Standard Deviation (Population) | 5.6% | 11.2% |
Similar Demographics by Child Poverty Among Boys Under 16
Demographics Similar to Sri Lankans by Child Poverty Among Boys Under 16
In terms of child poverty among boys under 16, the demographic groups most similar to Sri Lankans are Immigrants from Italy (14.9%, a difference of 0.0%), Argentinean (14.9%, a difference of 0.050%), Finnish (14.9%, a difference of 0.11%), Paraguayan (14.9%, a difference of 0.13%), and Immigrants from North Macedonia (14.9%, a difference of 0.36%).
| Demographics | Rating | Rank | Child Poverty Among Boys Under 16 |
| Germans | 97.2 /100 | #86 | Exceptional 14.8% |
| Northern Europeans | 97.2 /100 | #87 | Exceptional 14.8% |
| Immigrants | North America | 97.1 /100 | #88 | Exceptional 14.8% |
| Immigrants | Argentina | 97.1 /100 | #89 | Exceptional 14.8% |
| Austrians | 97.1 /100 | #90 | Exceptional 14.8% |
| Paraguayans | 96.8 /100 | #91 | Exceptional 14.9% |
| Argentineans | 96.7 /100 | #92 | Exceptional 14.9% |
| Sri Lankans | 96.7 /100 | #93 | Exceptional 14.9% |
| Immigrants | Italy | 96.7 /100 | #94 | Exceptional 14.9% |
| Finns | 96.5 /100 | #95 | Exceptional 14.9% |
| Immigrants | North Macedonia | 96.3 /100 | #96 | Exceptional 14.9% |
| Immigrants | Egypt | 96.2 /100 | #97 | Exceptional 14.9% |
| British | 96.2 /100 | #98 | Exceptional 15.0% |
| Immigrants | France | 96.1 /100 | #99 | Exceptional 15.0% |
| Chileans | 95.8 /100 | #100 | Exceptional 15.0% |
Demographics Similar to Immigrants from Bangladesh by Child Poverty Among Boys Under 16
In terms of child poverty among boys under 16, the demographic groups most similar to Immigrants from Bangladesh are Jamaican (20.0%, a difference of 0.12%), Belizean (19.9%, a difference of 0.25%), Subsaharan African (20.0%, a difference of 0.29%), Immigrants from Ecuador (19.8%, a difference of 0.39%), and Immigrants from Barbados (20.0%, a difference of 0.39%).
| Demographics | Rating | Rank | Child Poverty Among Boys Under 16 |
| Vietnamese | 0.1 /100 | #267 | Tragic 19.6% |
| Spanish American Indians | 0.1 /100 | #268 | Tragic 19.6% |
| Immigrants | Cabo Verde | 0.1 /100 | #269 | Tragic 19.7% |
| Cherokee | 0.1 /100 | #270 | Tragic 19.7% |
| Chickasaw | 0.1 /100 | #271 | Tragic 19.8% |
| Immigrants | Ecuador | 0.1 /100 | #272 | Tragic 19.8% |
| Belizeans | 0.1 /100 | #273 | Tragic 19.9% |
| Immigrants | Bangladesh | 0.0 /100 | #274 | Tragic 19.9% |
| Jamaicans | 0.0 /100 | #275 | Tragic 20.0% |
| Sub-Saharan Africans | 0.0 /100 | #276 | Tragic 20.0% |
| Immigrants | Barbados | 0.0 /100 | #277 | Tragic 20.0% |
| Immigrants | West Indies | 0.0 /100 | #278 | Tragic 20.0% |
| Bangladeshis | 0.0 /100 | #279 | Tragic 20.0% |
| Central Americans | 0.0 /100 | #280 | Tragic 20.1% |
| Immigrants | Zaire | 0.0 /100 | #281 | Tragic 20.1% |