Spanish American Indian vs Immigrants from Philippines Single Mother Poverty
COMPARE
Spanish American Indian
Immigrants from Philippines
Single Mother Poverty
Single Mother Poverty Comparison
Spanish American Indians
Immigrants from Philippines
29.6%
SINGLE MOTHER POVERTY
23.4/ 100
METRIC RATING
196th/ 347
METRIC RANK
26.5%
SINGLE MOTHER POVERTY
100.0/ 100
METRIC RATING
31st/ 347
METRIC RANK
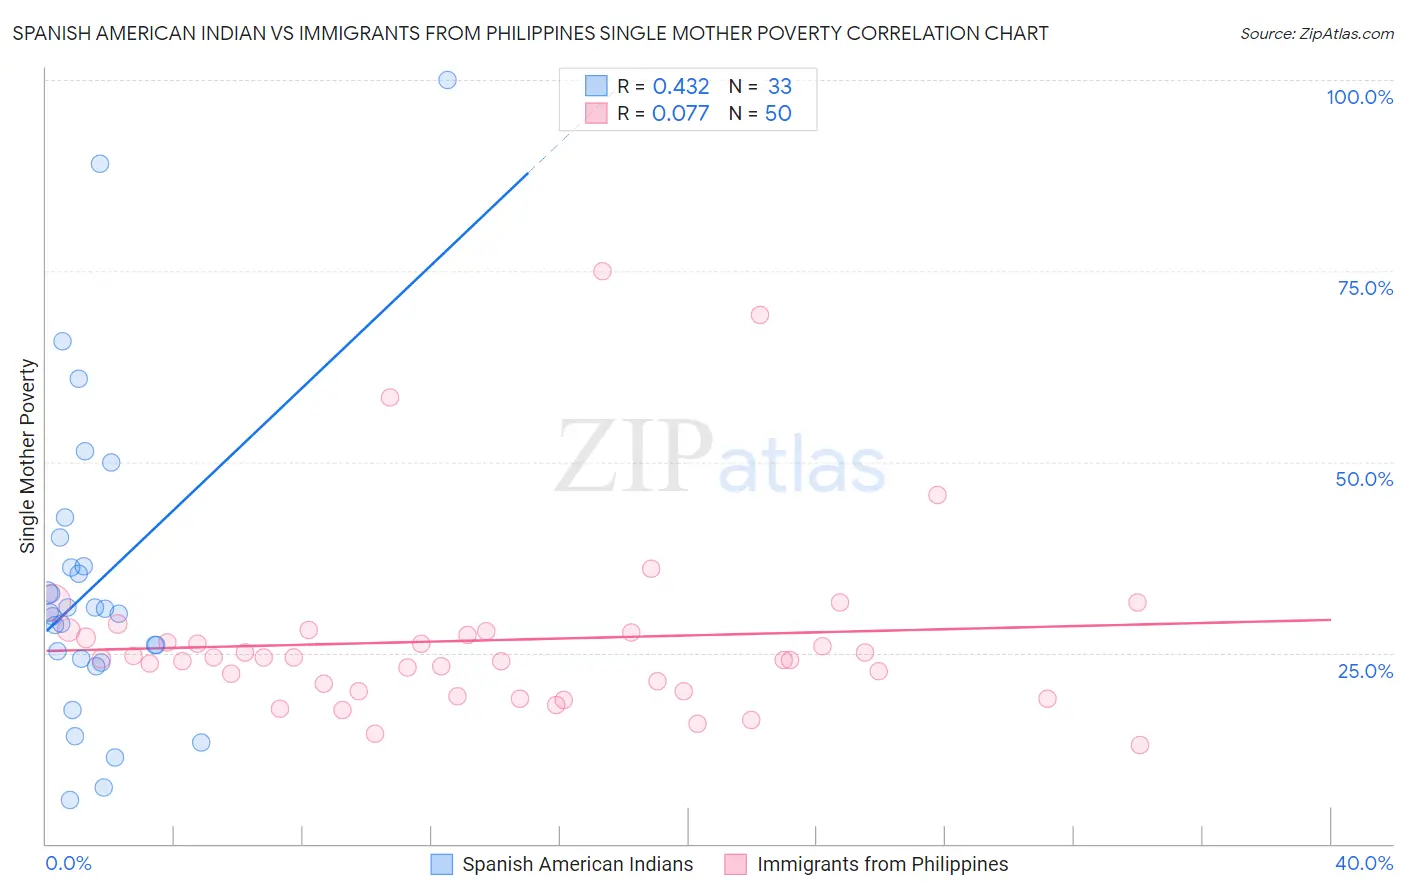
Spanish American Indian vs Immigrants from Philippines Single Mother Poverty Correlation Chart
The statistical analysis conducted on geographies consisting of 73,007,770 people shows a moderate positive correlation between the proportion of Spanish American Indians and poverty level among single mothers in the United States with a correlation coefficient (R) of 0.432 and weighted average of 29.6%. Similarly, the statistical analysis conducted on geographies consisting of 457,544,992 people shows a slight positive correlation between the proportion of Immigrants from Philippines and poverty level among single mothers in the United States with a correlation coefficient (R) of 0.077 and weighted average of 26.5%, a difference of 11.7%.
Single Mother Poverty Correlation Summary
| Measurement | Spanish American Indian | Immigrants from Philippines |
| Minimum | 5.7% | 12.9% |
| Maximum | 100.0% | 75.0% |
| Range | 94.3% | 62.1% |
| Mean | 34.3% | 26.6% |
| Median | 30.3% | 24.3% |
| Interquartile 25% (IQ1) | 24.0% | 20.0% |
| Interquartile 75% (IQ3) | 38.2% | 27.7% |
| Interquartile Range (IQR) | 14.2% | 7.7% |
| Standard Deviation (Sample) | 20.6% | 12.0% |
| Standard Deviation (Population) | 20.3% | 11.8% |
Similar Demographics by Single Mother Poverty
Demographics Similar to Spanish American Indians by Single Mother Poverty
In terms of single mother poverty, the demographic groups most similar to Spanish American Indians are Slavic (29.6%, a difference of 0.070%), Immigrants from Jamaica (29.6%, a difference of 0.10%), Trinidadian and Tobagonian (29.6%, a difference of 0.11%), Icelander (29.5%, a difference of 0.17%), and Cuban (29.6%, a difference of 0.18%).
| Demographics | Rating | Rank | Single Mother Poverty |
| Immigrants | Africa | 31.6 /100 | #189 | Fair 29.4% |
| Immigrants | Germany | 30.4 /100 | #190 | Fair 29.5% |
| Immigrants | Trinidad and Tobago | 29.2 /100 | #191 | Fair 29.5% |
| Moroccans | 28.6 /100 | #192 | Fair 29.5% |
| Basques | 28.3 /100 | #193 | Fair 29.5% |
| Icelanders | 26.1 /100 | #194 | Fair 29.5% |
| Slavs | 24.5 /100 | #195 | Fair 29.6% |
| Spanish American Indians | 23.4 /100 | #196 | Fair 29.6% |
| Immigrants | Jamaica | 22.0 /100 | #197 | Fair 29.6% |
| Trinidadians and Tobagonians | 21.7 /100 | #198 | Fair 29.6% |
| Cubans | 20.8 /100 | #199 | Fair 29.6% |
| Panamanians | 20.0 /100 | #200 | Fair 29.6% |
| Belgians | 18.8 /100 | #201 | Poor 29.7% |
| Malaysians | 17.4 /100 | #202 | Poor 29.7% |
| Swiss | 17.2 /100 | #203 | Poor 29.7% |
Demographics Similar to Immigrants from Philippines by Single Mother Poverty
In terms of single mother poverty, the demographic groups most similar to Immigrants from Philippines are Turkish (26.4%, a difference of 0.16%), Jordanian (26.4%, a difference of 0.24%), Tongan (26.5%, a difference of 0.25%), Bulgarian (26.5%, a difference of 0.28%), and Immigrants from Indonesia (26.6%, a difference of 0.29%).
| Demographics | Rating | Rank | Single Mother Poverty |
| Immigrants | Moldova | 100.0 /100 | #24 | Exceptional 26.2% |
| Immigrants | Asia | 100.0 /100 | #25 | Exceptional 26.3% |
| Immigrants | Sri Lanka | 100.0 /100 | #26 | Exceptional 26.3% |
| Immigrants | Japan | 100.0 /100 | #27 | Exceptional 26.4% |
| Koreans | 100.0 /100 | #28 | Exceptional 26.4% |
| Jordanians | 100.0 /100 | #29 | Exceptional 26.4% |
| Turks | 100.0 /100 | #30 | Exceptional 26.4% |
| Immigrants | Philippines | 100.0 /100 | #31 | Exceptional 26.5% |
| Tongans | 99.9 /100 | #32 | Exceptional 26.5% |
| Bulgarians | 99.9 /100 | #33 | Exceptional 26.5% |
| Immigrants | Indonesia | 99.9 /100 | #34 | Exceptional 26.6% |
| Maltese | 99.9 /100 | #35 | Exceptional 26.6% |
| Okinawans | 99.9 /100 | #36 | Exceptional 26.6% |
| Immigrants | Israel | 99.9 /100 | #37 | Exceptional 26.6% |
| Immigrants | Fiji | 99.9 /100 | #38 | Exceptional 26.6% |