Immigrants from Germany vs Immigrants from Kazakhstan Female Poverty Among 18-24 Year Olds
COMPARE
Immigrants from Germany
Immigrants from Kazakhstan
Female Poverty Among 18-24 Year Olds
Female Poverty Among 18-24 Year Olds Comparison
Immigrants from Germany
Immigrants from Kazakhstan
20.3%
FEMALE POVERTY AMONG 18-24 YEAR OLDS
34.0/ 100
METRIC RATING
189th/ 347
METRIC RANK
20.2%
FEMALE POVERTY AMONG 18-24 YEAR OLDS
44.2/ 100
METRIC RATING
177th/ 347
METRIC RANK
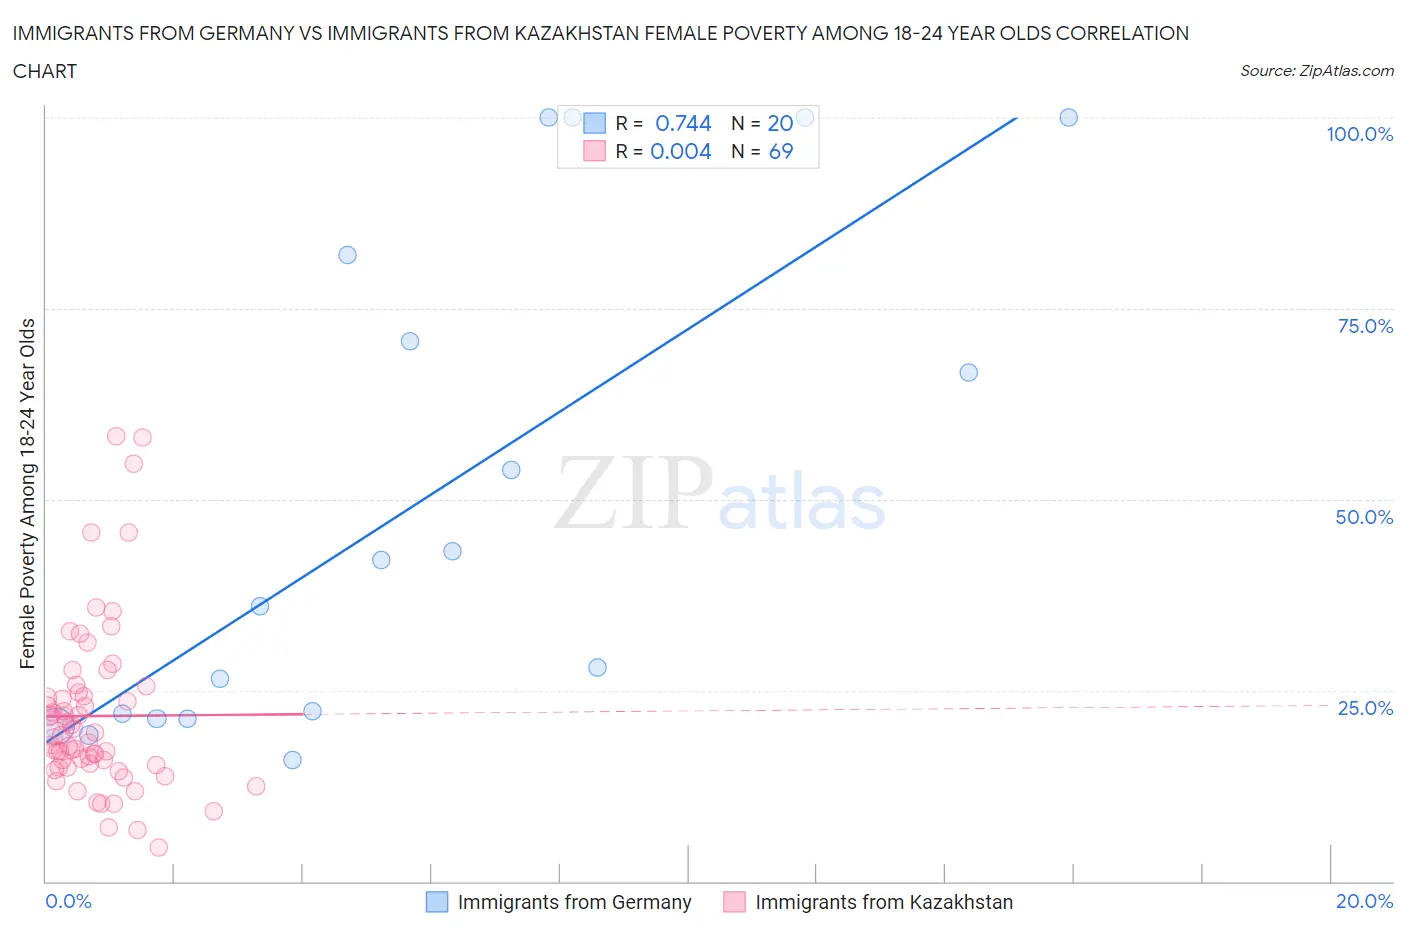
Immigrants from Germany vs Immigrants from Kazakhstan Female Poverty Among 18-24 Year Olds Correlation Chart
The statistical analysis conducted on geographies consisting of 447,977,087 people shows a strong positive correlation between the proportion of Immigrants from Germany and poverty level among females between the ages 18 and 24 in the United States with a correlation coefficient (R) of 0.744 and weighted average of 20.3%. Similarly, the statistical analysis conducted on geographies consisting of 123,639,864 people shows no correlation between the proportion of Immigrants from Kazakhstan and poverty level among females between the ages 18 and 24 in the United States with a correlation coefficient (R) of 0.004 and weighted average of 20.2%, a difference of 0.52%.
Female Poverty Among 18-24 Year Olds Correlation Summary
| Measurement | Immigrants from Germany | Immigrants from Kazakhstan |
| Minimum | 15.9% | 4.3% |
| Maximum | 100.0% | 58.3% |
| Range | 84.1% | 54.0% |
| Mean | 49.5% | 21.6% |
| Median | 39.0% | 18.9% |
| Interquartile 25% (IQ1) | 21.6% | 15.1% |
| Interquartile 75% (IQ3) | 76.3% | 24.5% |
| Interquartile Range (IQR) | 54.7% | 9.4% |
| Standard Deviation (Sample) | 31.9% | 11.1% |
| Standard Deviation (Population) | 31.1% | 11.0% |
Demographics Similar to Immigrants from Germany and Immigrants from Kazakhstan by Female Poverty Among 18-24 Year Olds
In terms of female poverty among 18-24 year olds, the demographic groups most similar to Immigrants from Germany are Scandinavian (20.3%, a difference of 0.030%), Immigrants from Mexico (20.2%, a difference of 0.12%), Immigrants from Ethiopia (20.2%, a difference of 0.17%), Immigrants from Western Asia (20.3%, a difference of 0.27%), and Nepalese (20.2%, a difference of 0.30%). Similarly, the demographic groups most similar to Immigrants from Kazakhstan are Swiss (20.2%, a difference of 0.010%), Ethiopian (20.2%, a difference of 0.020%), Kenyan (20.2%, a difference of 0.040%), Iraqi (20.2%, a difference of 0.040%), and Immigrants from China (20.2%, a difference of 0.060%).
| Demographics | Rating | Rank | Female Poverty Among 18-24 Year Olds |
| Irish | 50.0 /100 | #173 | Average 20.1% |
| Swedes | 50.0 /100 | #174 | Average 20.1% |
| South American Indians | 48.4 /100 | #175 | Average 20.1% |
| Kenyans | 44.9 /100 | #176 | Average 20.2% |
| Immigrants | Kazakhstan | 44.2 /100 | #177 | Average 20.2% |
| Swiss | 44.0 /100 | #178 | Average 20.2% |
| Ethiopians | 43.8 /100 | #179 | Average 20.2% |
| Iraqis | 43.3 /100 | #180 | Average 20.2% |
| Immigrants | China | 43.0 /100 | #181 | Average 20.2% |
| Immigrants | Barbados | 42.8 /100 | #182 | Average 20.2% |
| Lebanese | 40.6 /100 | #183 | Average 20.2% |
| Immigrants | Central America | 39.9 /100 | #184 | Fair 20.2% |
| Nepalese | 39.7 /100 | #185 | Fair 20.2% |
| Immigrants | Ethiopia | 37.3 /100 | #186 | Fair 20.2% |
| Immigrants | Mexico | 36.3 /100 | #187 | Fair 20.2% |
| Scandinavians | 34.6 /100 | #188 | Fair 20.3% |
| Immigrants | Germany | 34.0 /100 | #189 | Fair 20.3% |
| Immigrants | Western Asia | 29.3 /100 | #190 | Fair 20.3% |
| Moroccans | 25.8 /100 | #191 | Fair 20.4% |
| Immigrants | Israel | 24.4 /100 | #192 | Fair 20.4% |
| Nigerians | 23.4 /100 | #193 | Fair 20.4% |