Spaniard vs Pennsylvania German Child Poverty Under the Age of 16
COMPARE
Spaniard
Pennsylvania German
Child Poverty Under the Age of 16
Child Poverty Under the Age of 16 Comparison
Spaniards
Pennsylvania Germans
16.8%
CHILD POVERTY UNDER THE AGE OF 16
23.2/ 100
METRIC RATING
193rd/ 347
METRIC RANK
17.4%
CHILD POVERTY UNDER THE AGE OF 16
7.5/ 100
METRIC RATING
208th/ 347
METRIC RANK
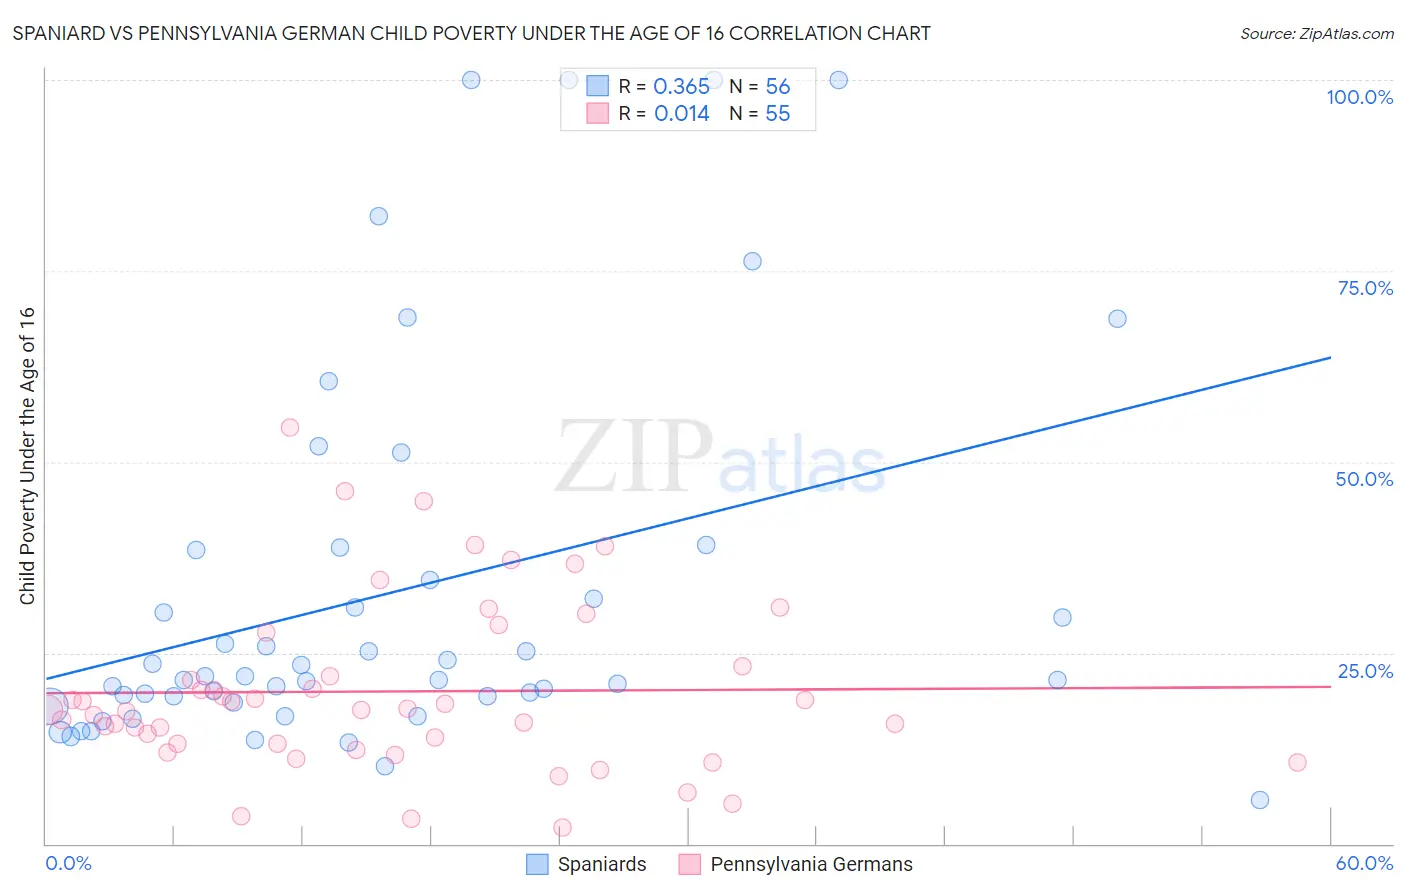
Spaniard vs Pennsylvania German Child Poverty Under the Age of 16 Correlation Chart
The statistical analysis conducted on geographies consisting of 438,691,641 people shows a mild positive correlation between the proportion of Spaniards and poverty level among children under the age of 16 in the United States with a correlation coefficient (R) of 0.365 and weighted average of 16.8%. Similarly, the statistical analysis conducted on geographies consisting of 232,153,334 people shows no correlation between the proportion of Pennsylvania Germans and poverty level among children under the age of 16 in the United States with a correlation coefficient (R) of 0.014 and weighted average of 17.4%, a difference of 3.8%.
Child Poverty Under the Age of 16 Correlation Summary
| Measurement | Spaniard | Pennsylvania German |
| Minimum | 5.7% | 2.1% |
| Maximum | 100.0% | 54.5% |
| Range | 94.3% | 52.4% |
| Mean | 32.9% | 19.9% |
| Median | 21.7% | 17.5% |
| Interquartile 25% (IQ1) | 18.9% | 13.0% |
| Interquartile 75% (IQ3) | 36.5% | 23.3% |
| Interquartile Range (IQR) | 17.7% | 10.2% |
| Standard Deviation (Sample) | 25.0% | 11.2% |
| Standard Deviation (Population) | 24.7% | 11.1% |
Demographics Similar to Spaniards and Pennsylvania Germans by Child Poverty Under the Age of 16
In terms of child poverty under the age of 16, the demographic groups most similar to Spaniards are Immigrants from Uruguay (16.8%, a difference of 0.020%), Immigrants from Uganda (16.8%, a difference of 0.11%), Immigrants from Lebanon (16.8%, a difference of 0.19%), Spanish (16.7%, a difference of 0.20%), and Immigrants from Kenya (16.9%, a difference of 0.71%). Similarly, the demographic groups most similar to Pennsylvania Germans are Panamanian (17.5%, a difference of 0.25%), Alaskan Athabascan (17.5%, a difference of 0.27%), German Russian (17.4%, a difference of 0.40%), Alaska Native (17.2%, a difference of 1.4%), and Aleut (17.1%, a difference of 2.0%).
| Demographics | Rating | Rank | Child Poverty Under the Age of 16 |
| Immigrants | Costa Rica | 29.6 /100 | #190 | Fair 16.6% |
| Immigrants | Iraq | 28.3 /100 | #191 | Fair 16.7% |
| Spanish | 24.5 /100 | #192 | Fair 16.7% |
| Spaniards | 23.2 /100 | #193 | Fair 16.8% |
| Immigrants | Uruguay | 23.1 /100 | #194 | Fair 16.8% |
| Immigrants | Uganda | 22.5 /100 | #195 | Fair 16.8% |
| Immigrants | Lebanon | 22.0 /100 | #196 | Fair 16.8% |
| Immigrants | Kenya | 19.1 /100 | #197 | Poor 16.9% |
| Delaware | 17.1 /100 | #198 | Poor 17.0% |
| Immigrants | Afghanistan | 15.1 /100 | #199 | Poor 17.0% |
| Immigrants | Cameroon | 14.7 /100 | #200 | Poor 17.1% |
| Immigrants | Uzbekistan | 14.7 /100 | #201 | Poor 17.1% |
| Ugandans | 14.3 /100 | #202 | Poor 17.1% |
| Immigrants | Sierra Leone | 14.2 /100 | #203 | Poor 17.1% |
| Hmong | 14.0 /100 | #204 | Poor 17.1% |
| Aleuts | 13.9 /100 | #205 | Poor 17.1% |
| Alaska Natives | 11.8 /100 | #206 | Poor 17.2% |
| German Russians | 8.6 /100 | #207 | Tragic 17.4% |
| Pennsylvania Germans | 7.5 /100 | #208 | Tragic 17.4% |
| Panamanians | 6.9 /100 | #209 | Tragic 17.5% |
| Alaskan Athabascans | 6.9 /100 | #210 | Tragic 17.5% |