Immigrants from Oceania vs Pennsylvania German Child Poverty Under the Age of 16
COMPARE
Immigrants from Oceania
Pennsylvania German
Child Poverty Under the Age of 16
Child Poverty Under the Age of 16 Comparison
Immigrants from Oceania
Pennsylvania Germans
15.9%
CHILD POVERTY UNDER THE AGE OF 16
65.4/ 100
METRIC RATING
166th/ 347
METRIC RANK
17.4%
CHILD POVERTY UNDER THE AGE OF 16
7.5/ 100
METRIC RATING
208th/ 347
METRIC RANK
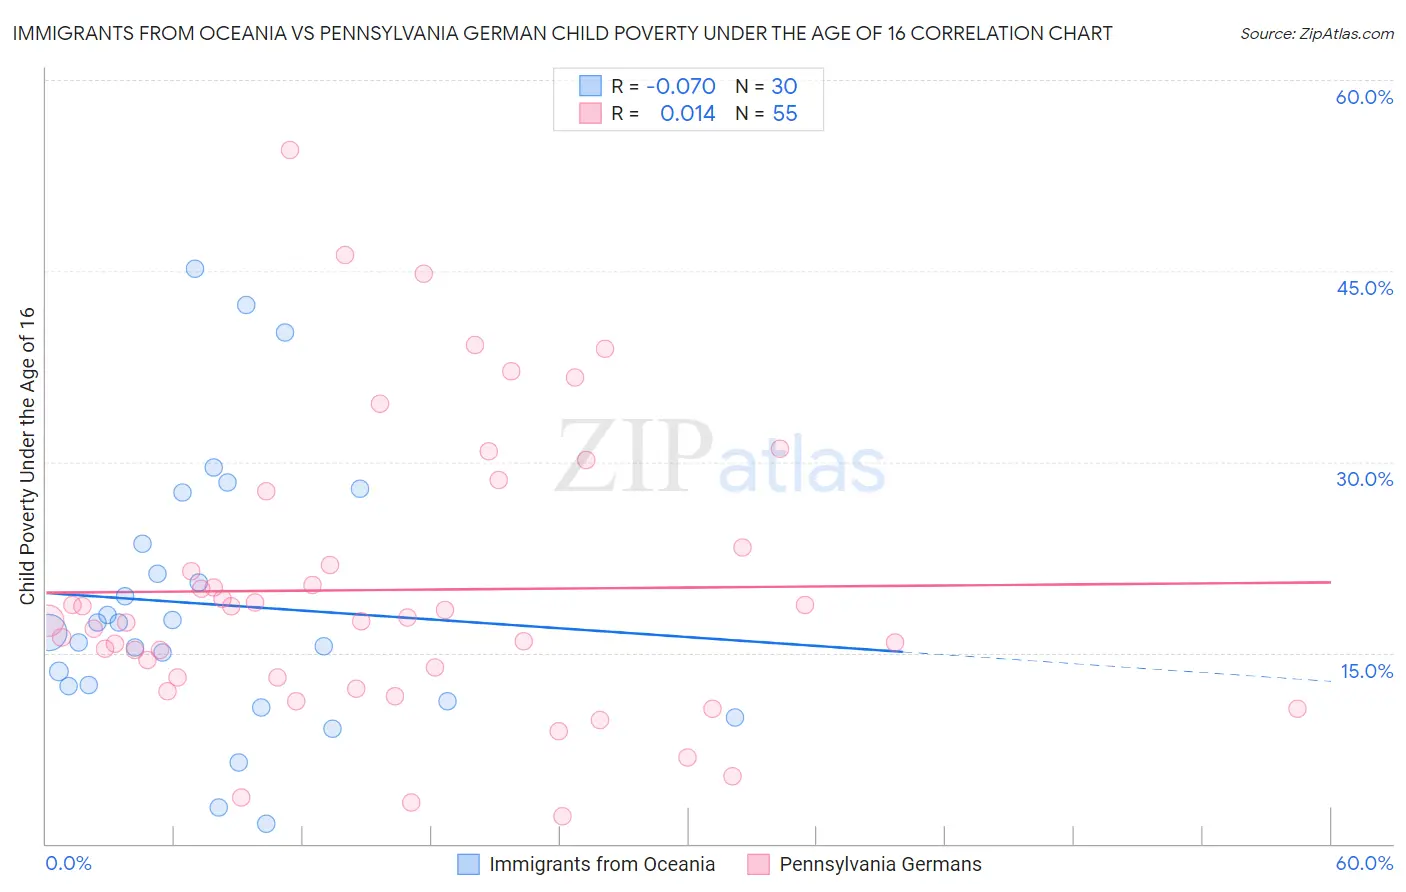
Immigrants from Oceania vs Pennsylvania German Child Poverty Under the Age of 16 Correlation Chart
The statistical analysis conducted on geographies consisting of 303,303,395 people shows a slight negative correlation between the proportion of Immigrants from Oceania and poverty level among children under the age of 16 in the United States with a correlation coefficient (R) of -0.070 and weighted average of 15.9%. Similarly, the statistical analysis conducted on geographies consisting of 232,153,334 people shows no correlation between the proportion of Pennsylvania Germans and poverty level among children under the age of 16 in the United States with a correlation coefficient (R) of 0.014 and weighted average of 17.4%, a difference of 9.6%.
Child Poverty Under the Age of 16 Correlation Summary
| Measurement | Immigrants from Oceania | Pennsylvania German |
| Minimum | 1.6% | 2.1% |
| Maximum | 45.2% | 54.5% |
| Range | 43.6% | 52.4% |
| Mean | 18.8% | 19.9% |
| Median | 17.0% | 17.5% |
| Interquartile 25% (IQ1) | 12.4% | 13.0% |
| Interquartile 75% (IQ3) | 23.5% | 23.3% |
| Interquartile Range (IQR) | 11.1% | 10.2% |
| Standard Deviation (Sample) | 10.6% | 11.2% |
| Standard Deviation (Population) | 10.4% | 11.1% |
Similar Demographics by Child Poverty Under the Age of 16
Demographics Similar to Immigrants from Oceania by Child Poverty Under the Age of 16
In terms of child poverty under the age of 16, the demographic groups most similar to Immigrants from Oceania are Guamanian/Chamorro (15.9%, a difference of 0.13%), Immigrants from Germany (15.8%, a difference of 0.27%), Colombian (15.8%, a difference of 0.30%), Yugoslavian (15.8%, a difference of 0.30%), and Immigrants from Northern Africa (15.8%, a difference of 0.37%).
| Demographics | Rating | Rank | Child Poverty Under the Age of 16 |
| Immigrants | Fiji | 71.1 /100 | #159 | Good 15.8% |
| Immigrants | Albania | 70.7 /100 | #160 | Good 15.8% |
| Immigrants | Northern Africa | 68.1 /100 | #161 | Good 15.8% |
| Colombians | 67.6 /100 | #162 | Good 15.8% |
| Yugoslavians | 67.6 /100 | #163 | Good 15.8% |
| Immigrants | Germany | 67.3 /100 | #164 | Good 15.8% |
| Guamanians/Chamorros | 66.4 /100 | #165 | Good 15.9% |
| Immigrants | Oceania | 65.4 /100 | #166 | Good 15.9% |
| Costa Ricans | 61.1 /100 | #167 | Good 16.0% |
| South Americans | 57.9 /100 | #168 | Average 16.0% |
| Uruguayans | 54.7 /100 | #169 | Average 16.1% |
| Immigrants | Colombia | 54.4 /100 | #170 | Average 16.1% |
| Hungarians | 52.5 /100 | #171 | Average 16.2% |
| Afghans | 52.3 /100 | #172 | Average 16.2% |
| Immigrants | Saudi Arabia | 52.1 /100 | #173 | Average 16.2% |
Demographics Similar to Pennsylvania Germans by Child Poverty Under the Age of 16
In terms of child poverty under the age of 16, the demographic groups most similar to Pennsylvania Germans are Panamanian (17.5%, a difference of 0.25%), Alaskan Athabascan (17.5%, a difference of 0.27%), Immigrants from Thailand (17.5%, a difference of 0.39%), German Russian (17.4%, a difference of 0.40%), and Immigrants (17.5%, a difference of 0.42%).
| Demographics | Rating | Rank | Child Poverty Under the Age of 16 |
| Immigrants | Uzbekistan | 14.7 /100 | #201 | Poor 17.1% |
| Ugandans | 14.3 /100 | #202 | Poor 17.1% |
| Immigrants | Sierra Leone | 14.2 /100 | #203 | Poor 17.1% |
| Hmong | 14.0 /100 | #204 | Poor 17.1% |
| Aleuts | 13.9 /100 | #205 | Poor 17.1% |
| Alaska Natives | 11.8 /100 | #206 | Poor 17.2% |
| German Russians | 8.6 /100 | #207 | Tragic 17.4% |
| Pennsylvania Germans | 7.5 /100 | #208 | Tragic 17.4% |
| Panamanians | 6.9 /100 | #209 | Tragic 17.5% |
| Alaskan Athabascans | 6.9 /100 | #210 | Tragic 17.5% |
| Immigrants | Thailand | 6.6 /100 | #211 | Tragic 17.5% |
| Immigrants | Immigrants | 6.5 /100 | #212 | Tragic 17.5% |
| Immigrants | Azores | 6.2 /100 | #213 | Tragic 17.5% |
| Iraqis | 5.9 /100 | #214 | Tragic 17.5% |
| Malaysians | 5.9 /100 | #215 | Tragic 17.5% |