Eastern European vs Pennsylvania German Child Poverty Under the Age of 16
COMPARE
Eastern European
Pennsylvania German
Child Poverty Under the Age of 16
Child Poverty Under the Age of 16 Comparison
Eastern Europeans
Pennsylvania Germans
13.2%
CHILD POVERTY UNDER THE AGE OF 16
99.8/ 100
METRIC RATING
25th/ 347
METRIC RANK
17.4%
CHILD POVERTY UNDER THE AGE OF 16
7.5/ 100
METRIC RATING
208th/ 347
METRIC RANK
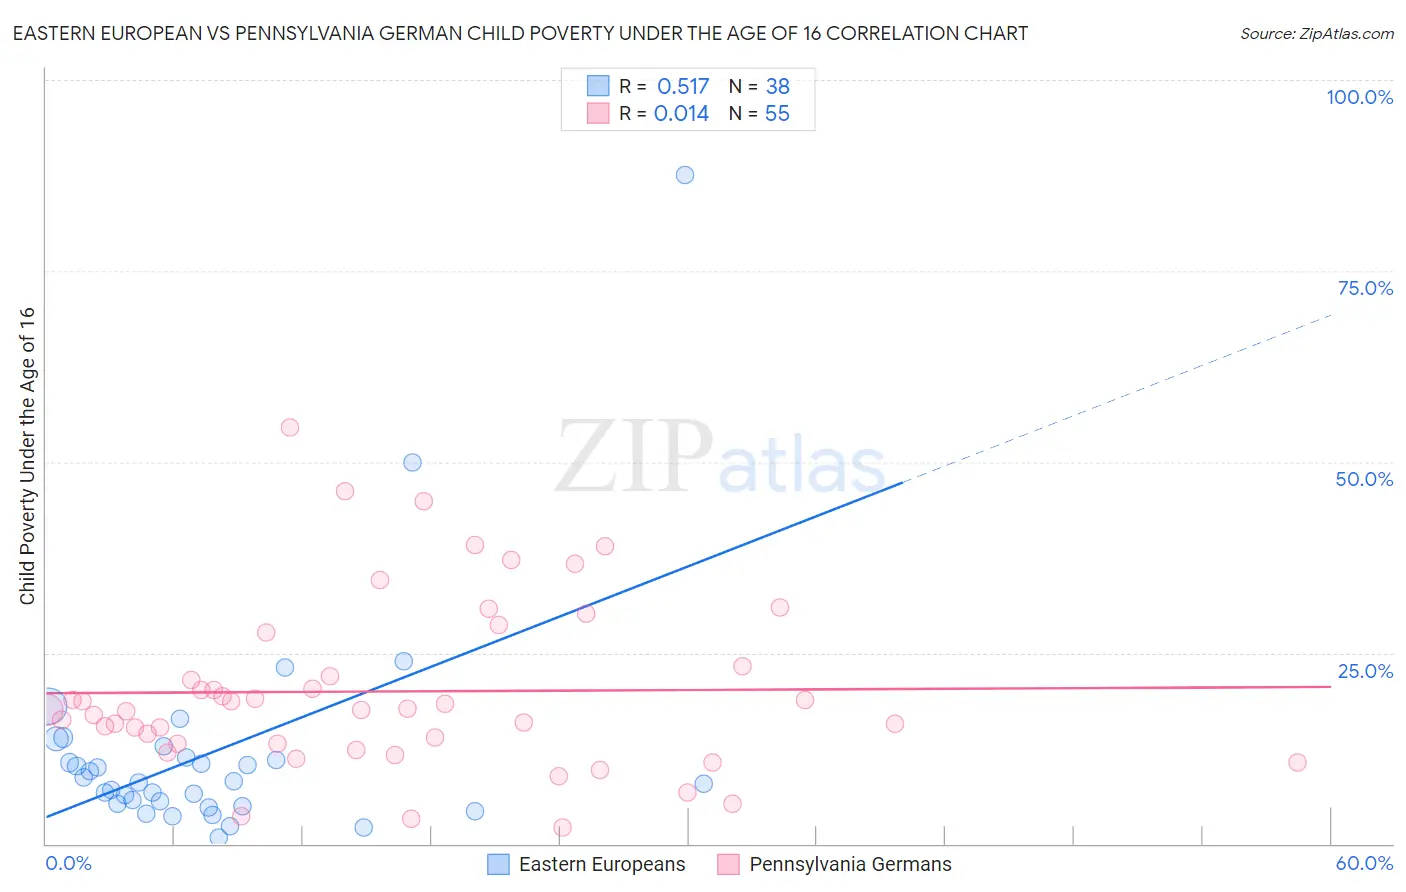
Eastern European vs Pennsylvania German Child Poverty Under the Age of 16 Correlation Chart
The statistical analysis conducted on geographies consisting of 454,217,761 people shows a substantial positive correlation between the proportion of Eastern Europeans and poverty level among children under the age of 16 in the United States with a correlation coefficient (R) of 0.517 and weighted average of 13.2%. Similarly, the statistical analysis conducted on geographies consisting of 232,153,334 people shows no correlation between the proportion of Pennsylvania Germans and poverty level among children under the age of 16 in the United States with a correlation coefficient (R) of 0.014 and weighted average of 17.4%, a difference of 32.2%.
Child Poverty Under the Age of 16 Correlation Summary
| Measurement | Eastern European | Pennsylvania German |
| Minimum | 0.77% | 2.1% |
| Maximum | 87.5% | 54.5% |
| Range | 86.7% | 52.4% |
| Mean | 12.0% | 19.9% |
| Median | 8.1% | 17.5% |
| Interquartile 25% (IQ1) | 5.2% | 13.0% |
| Interquartile 75% (IQ3) | 11.3% | 23.3% |
| Interquartile Range (IQR) | 6.1% | 10.2% |
| Standard Deviation (Sample) | 15.2% | 11.2% |
| Standard Deviation (Population) | 15.0% | 11.1% |
Similar Demographics by Child Poverty Under the Age of 16
Demographics Similar to Eastern Europeans by Child Poverty Under the Age of 16
In terms of child poverty under the age of 16, the demographic groups most similar to Eastern Europeans are Latvian (13.2%, a difference of 0.080%), Indian (Asian) (13.1%, a difference of 0.29%), Maltese (13.1%, a difference of 0.33%), Immigrants from Eastern Asia (13.1%, a difference of 0.41%), and Bolivian (13.2%, a difference of 0.42%).
| Demographics | Rating | Rank | Child Poverty Under the Age of 16 |
| Cypriots | 99.9 /100 | #18 | Exceptional 13.0% |
| Immigrants | Japan | 99.8 /100 | #19 | Exceptional 13.0% |
| Okinawans | 99.8 /100 | #20 | Exceptional 13.1% |
| Immigrants | Eastern Asia | 99.8 /100 | #21 | Exceptional 13.1% |
| Maltese | 99.8 /100 | #22 | Exceptional 13.1% |
| Indians (Asian) | 99.8 /100 | #23 | Exceptional 13.1% |
| Latvians | 99.8 /100 | #24 | Exceptional 13.2% |
| Eastern Europeans | 99.8 /100 | #25 | Exceptional 13.2% |
| Bolivians | 99.8 /100 | #26 | Exceptional 13.2% |
| Immigrants | China | 99.8 /100 | #27 | Exceptional 13.3% |
| Assyrians/Chaldeans/Syriacs | 99.7 /100 | #28 | Exceptional 13.3% |
| Swedes | 99.7 /100 | #29 | Exceptional 13.3% |
| Turks | 99.7 /100 | #30 | Exceptional 13.4% |
| Danes | 99.7 /100 | #31 | Exceptional 13.4% |
| Tongans | 99.7 /100 | #32 | Exceptional 13.4% |
Demographics Similar to Pennsylvania Germans by Child Poverty Under the Age of 16
In terms of child poverty under the age of 16, the demographic groups most similar to Pennsylvania Germans are Panamanian (17.5%, a difference of 0.25%), Alaskan Athabascan (17.5%, a difference of 0.27%), Immigrants from Thailand (17.5%, a difference of 0.39%), German Russian (17.4%, a difference of 0.40%), and Immigrants (17.5%, a difference of 0.42%).
| Demographics | Rating | Rank | Child Poverty Under the Age of 16 |
| Immigrants | Uzbekistan | 14.7 /100 | #201 | Poor 17.1% |
| Ugandans | 14.3 /100 | #202 | Poor 17.1% |
| Immigrants | Sierra Leone | 14.2 /100 | #203 | Poor 17.1% |
| Hmong | 14.0 /100 | #204 | Poor 17.1% |
| Aleuts | 13.9 /100 | #205 | Poor 17.1% |
| Alaska Natives | 11.8 /100 | #206 | Poor 17.2% |
| German Russians | 8.6 /100 | #207 | Tragic 17.4% |
| Pennsylvania Germans | 7.5 /100 | #208 | Tragic 17.4% |
| Panamanians | 6.9 /100 | #209 | Tragic 17.5% |
| Alaskan Athabascans | 6.9 /100 | #210 | Tragic 17.5% |
| Immigrants | Thailand | 6.6 /100 | #211 | Tragic 17.5% |
| Immigrants | Immigrants | 6.5 /100 | #212 | Tragic 17.5% |
| Immigrants | Azores | 6.2 /100 | #213 | Tragic 17.5% |
| Iraqis | 5.9 /100 | #214 | Tragic 17.5% |
| Malaysians | 5.9 /100 | #215 | Tragic 17.5% |