Immigrants from Europe vs Romanian Female Poverty Among 18-24 Year Olds
COMPARE
Immigrants from Europe
Romanian
Female Poverty Among 18-24 Year Olds
Female Poverty Among 18-24 Year Olds Comparison
Immigrants from Europe
Romanians
18.8%
FEMALE POVERTY AMONG 18-24 YEAR OLDS
99.5/ 100
METRIC RATING
78th/ 347
METRIC RANK
19.0%
FEMALE POVERTY AMONG 18-24 YEAR OLDS
98.9/ 100
METRIC RATING
91st/ 347
METRIC RANK
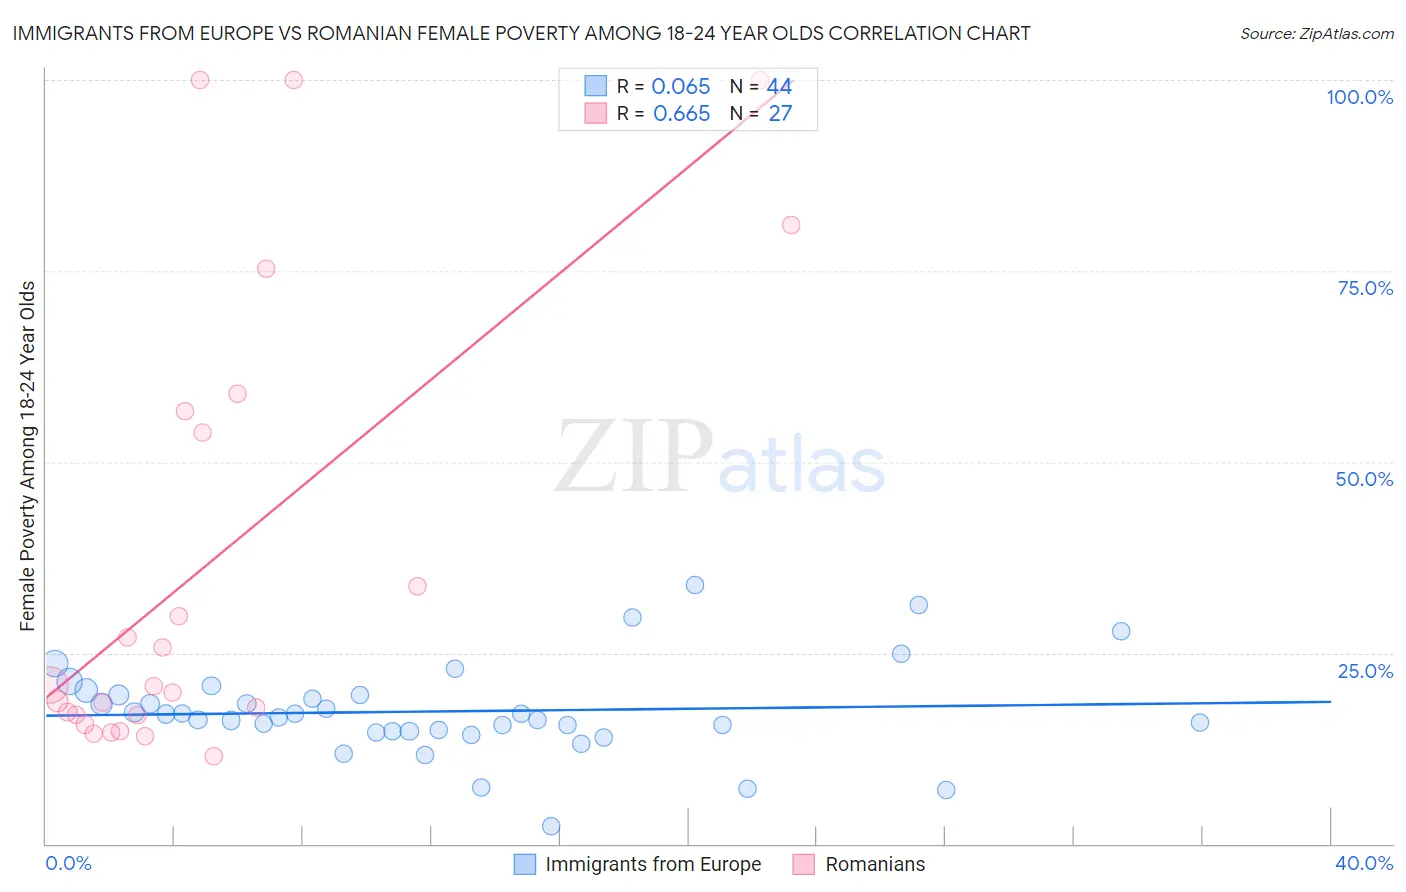
Immigrants from Europe vs Romanian Female Poverty Among 18-24 Year Olds Correlation Chart
The statistical analysis conducted on geographies consisting of 519,189,287 people shows a slight positive correlation between the proportion of Immigrants from Europe and poverty level among females between the ages 18 and 24 in the United States with a correlation coefficient (R) of 0.065 and weighted average of 18.8%. Similarly, the statistical analysis conducted on geographies consisting of 367,156,694 people shows a significant positive correlation between the proportion of Romanians and poverty level among females between the ages 18 and 24 in the United States with a correlation coefficient (R) of 0.665 and weighted average of 19.0%, a difference of 0.98%.
Female Poverty Among 18-24 Year Olds Correlation Summary
| Measurement | Immigrants from Europe | Romanian |
| Minimum | 2.3% | 11.4% |
| Maximum | 33.9% | 100.0% |
| Range | 31.6% | 88.6% |
| Mean | 17.3% | 36.8% |
| Median | 16.8% | 20.7% |
| Interquartile 25% (IQ1) | 14.7% | 16.8% |
| Interquartile 75% (IQ3) | 19.5% | 56.7% |
| Interquartile Range (IQR) | 4.8% | 39.9% |
| Standard Deviation (Sample) | 6.1% | 29.7% |
| Standard Deviation (Population) | 6.0% | 29.2% |
Demographics Similar to Immigrants from Europe and Romanians by Female Poverty Among 18-24 Year Olds
In terms of female poverty among 18-24 year olds, the demographic groups most similar to Immigrants from Europe are Uruguayan (18.8%, a difference of 0.0%), Costa Rican (18.8%, a difference of 0.010%), Palestinian (18.8%, a difference of 0.080%), Japanese (18.8%, a difference of 0.080%), and Immigrants from Cambodia (18.8%, a difference of 0.11%). Similarly, the demographic groups most similar to Romanians are Filipino (19.0%, a difference of 0.050%), Haitian (19.0%, a difference of 0.070%), Afghan (19.0%, a difference of 0.090%), Immigrants from Cabo Verde (19.0%, a difference of 0.12%), and Ukrainian (19.0%, a difference of 0.13%).
| Demographics | Rating | Rank | Female Poverty Among 18-24 Year Olds |
| Hawaiians | 99.6 /100 | #74 | Exceptional 18.7% |
| Poles | 99.6 /100 | #75 | Exceptional 18.8% |
| Immigrants | Cambodia | 99.5 /100 | #76 | Exceptional 18.8% |
| Costa Ricans | 99.5 /100 | #77 | Exceptional 18.8% |
| Immigrants | Europe | 99.5 /100 | #78 | Exceptional 18.8% |
| Uruguayans | 99.5 /100 | #79 | Exceptional 18.8% |
| Palestinians | 99.5 /100 | #80 | Exceptional 18.8% |
| Japanese | 99.5 /100 | #81 | Exceptional 18.8% |
| Immigrants | Uruguay | 99.4 /100 | #82 | Exceptional 18.8% |
| Immigrants | Indonesia | 99.4 /100 | #83 | Exceptional 18.9% |
| Burmese | 99.2 /100 | #84 | Exceptional 18.9% |
| Immigrants | Armenia | 99.2 /100 | #85 | Exceptional 18.9% |
| Immigrants | Iraq | 99.2 /100 | #86 | Exceptional 18.9% |
| Immigrants | Jamaica | 99.2 /100 | #87 | Exceptional 18.9% |
| Croatians | 99.1 /100 | #88 | Exceptional 19.0% |
| Immigrants | Cabo Verde | 99.0 /100 | #89 | Exceptional 19.0% |
| Afghans | 99.0 /100 | #90 | Exceptional 19.0% |
| Romanians | 98.9 /100 | #91 | Exceptional 19.0% |
| Filipinos | 98.9 /100 | #92 | Exceptional 19.0% |
| Haitians | 98.9 /100 | #93 | Exceptional 19.0% |
| Ukrainians | 98.8 /100 | #94 | Exceptional 19.0% |