Japanese vs Immigrants from Eastern Asia Female Poverty Among 25-34 Year Olds
COMPARE
Japanese
Immigrants from Eastern Asia
Female Poverty Among 25-34 Year Olds
Female Poverty Among 25-34 Year Olds Comparison
Japanese
Immigrants from Eastern Asia
14.1%
FEMALE POVERTY AMONG 25-34 YEAR OLDS
11.7/ 100
METRIC RATING
207th/ 347
METRIC RANK
11.2%
FEMALE POVERTY AMONG 25-34 YEAR OLDS
100.0/ 100
METRIC RATING
18th/ 347
METRIC RANK
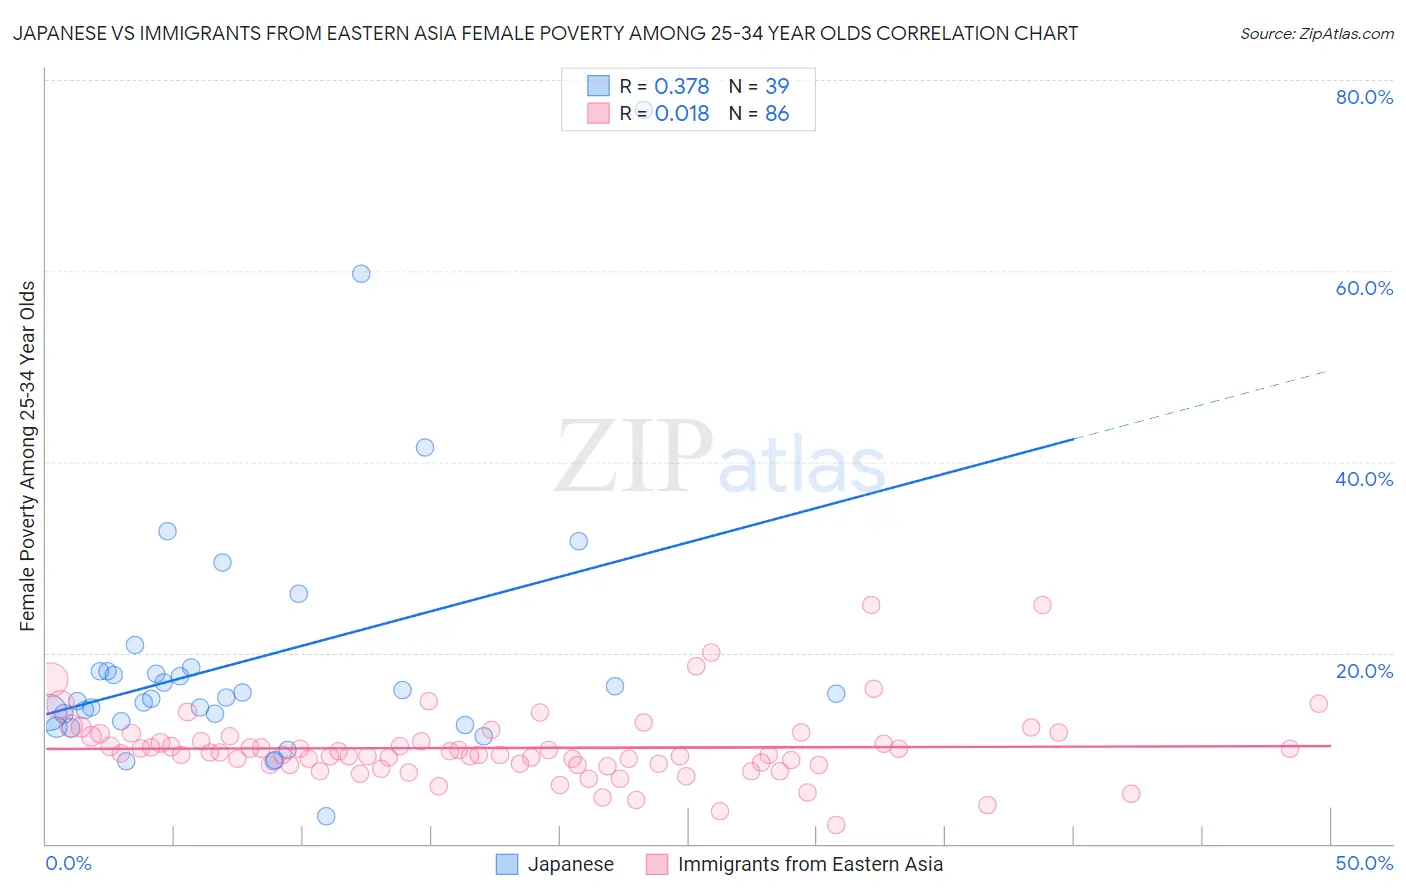
Japanese vs Immigrants from Eastern Asia Female Poverty Among 25-34 Year Olds Correlation Chart
The statistical analysis conducted on geographies consisting of 247,459,659 people shows a mild positive correlation between the proportion of Japanese and poverty level among females between the ages 25 and 34 in the United States with a correlation coefficient (R) of 0.378 and weighted average of 14.1%. Similarly, the statistical analysis conducted on geographies consisting of 486,963,543 people shows no correlation between the proportion of Immigrants from Eastern Asia and poverty level among females between the ages 25 and 34 in the United States with a correlation coefficient (R) of 0.018 and weighted average of 11.2%, a difference of 25.8%.
Female Poverty Among 25-34 Year Olds Correlation Summary
| Measurement | Japanese | Immigrants from Eastern Asia |
| Minimum | 2.8% | 1.9% |
| Maximum | 76.9% | 25.0% |
| Range | 74.1% | 23.1% |
| Mean | 19.3% | 10.0% |
| Median | 15.3% | 9.4% |
| Interquartile 25% (IQ1) | 12.8% | 8.2% |
| Interquartile 75% (IQ3) | 18.1% | 11.3% |
| Interquartile Range (IQR) | 5.3% | 3.0% |
| Standard Deviation (Sample) | 13.8% | 3.8% |
| Standard Deviation (Population) | 13.6% | 3.8% |
Similar Demographics by Female Poverty Among 25-34 Year Olds
Demographics Similar to Japanese by Female Poverty Among 25-34 Year Olds
In terms of female poverty among 25-34 year olds, the demographic groups most similar to Japanese are Hungarian (14.1%, a difference of 0.020%), Immigrants from Panama (14.1%, a difference of 0.020%), Immigrants from Africa (14.1%, a difference of 0.30%), Hawaiian (14.1%, a difference of 0.35%), and Immigrants (14.0%, a difference of 0.49%).
| Demographics | Rating | Rank | Female Poverty Among 25-34 Year Olds |
| Hmong | 20.3 /100 | #200 | Fair 13.9% |
| Immigrants | Trinidad and Tobago | 17.6 /100 | #201 | Poor 14.0% |
| Welsh | 17.2 /100 | #202 | Poor 14.0% |
| Immigrants | Immigrants | 14.5 /100 | #203 | Poor 14.0% |
| Hawaiians | 13.6 /100 | #204 | Poor 14.1% |
| Immigrants | Africa | 13.4 /100 | #205 | Poor 14.1% |
| Hungarians | 11.8 /100 | #206 | Poor 14.1% |
| Japanese | 11.7 /100 | #207 | Poor 14.1% |
| Immigrants | Panama | 11.6 /100 | #208 | Poor 14.1% |
| Guyanese | 8.6 /100 | #209 | Tragic 14.2% |
| Panamanians | 8.6 /100 | #210 | Tragic 14.2% |
| Trinidadians and Tobagonians | 8.2 /100 | #211 | Tragic 14.2% |
| Immigrants | Guyana | 6.6 /100 | #212 | Tragic 14.3% |
| Puget Sound Salish | 6.5 /100 | #213 | Tragic 14.3% |
| French | 6.2 /100 | #214 | Tragic 14.3% |
Demographics Similar to Immigrants from Eastern Asia by Female Poverty Among 25-34 Year Olds
In terms of female poverty among 25-34 year olds, the demographic groups most similar to Immigrants from Eastern Asia are Immigrants from China (11.2%, a difference of 0.11%), Iranian (11.2%, a difference of 0.14%), Immigrants from Bolivia (11.2%, a difference of 0.18%), Assyrian/Chaldean/Syriac (11.2%, a difference of 0.22%), and Burmese (11.2%, a difference of 0.33%).
| Demographics | Rating | Rank | Female Poverty Among 25-34 Year Olds |
| Immigrants | Korea | 100.0 /100 | #11 | Exceptional 11.1% |
| Immigrants | Ireland | 100.0 /100 | #12 | Exceptional 11.2% |
| Burmese | 100.0 /100 | #13 | Exceptional 11.2% |
| Indians (Asian) | 100.0 /100 | #14 | Exceptional 11.2% |
| Assyrians/Chaldeans/Syriacs | 100.0 /100 | #15 | Exceptional 11.2% |
| Immigrants | Bolivia | 100.0 /100 | #16 | Exceptional 11.2% |
| Immigrants | China | 100.0 /100 | #17 | Exceptional 11.2% |
| Immigrants | Eastern Asia | 100.0 /100 | #18 | Exceptional 11.2% |
| Iranians | 100.0 /100 | #19 | Exceptional 11.2% |
| Okinawans | 100.0 /100 | #20 | Exceptional 11.3% |
| Turks | 100.0 /100 | #21 | Exceptional 11.4% |
| Asians | 99.9 /100 | #22 | Exceptional 11.4% |
| Bolivians | 99.9 /100 | #23 | Exceptional 11.4% |
| Maltese | 99.9 /100 | #24 | Exceptional 11.4% |
| Bhutanese | 99.9 /100 | #25 | Exceptional 11.4% |