Slovene vs Immigrants from Chile Single Male Poverty
COMPARE
Slovene
Immigrants from Chile
Single Male Poverty
Single Male Poverty Comparison
Slovenes
Immigrants from Chile
13.0%
SINGLE MALE POVERTY
21.6/ 100
METRIC RATING
200th/ 347
METRIC RANK
12.1%
SINGLE MALE POVERTY
98.6/ 100
METRIC RATING
83rd/ 347
METRIC RANK
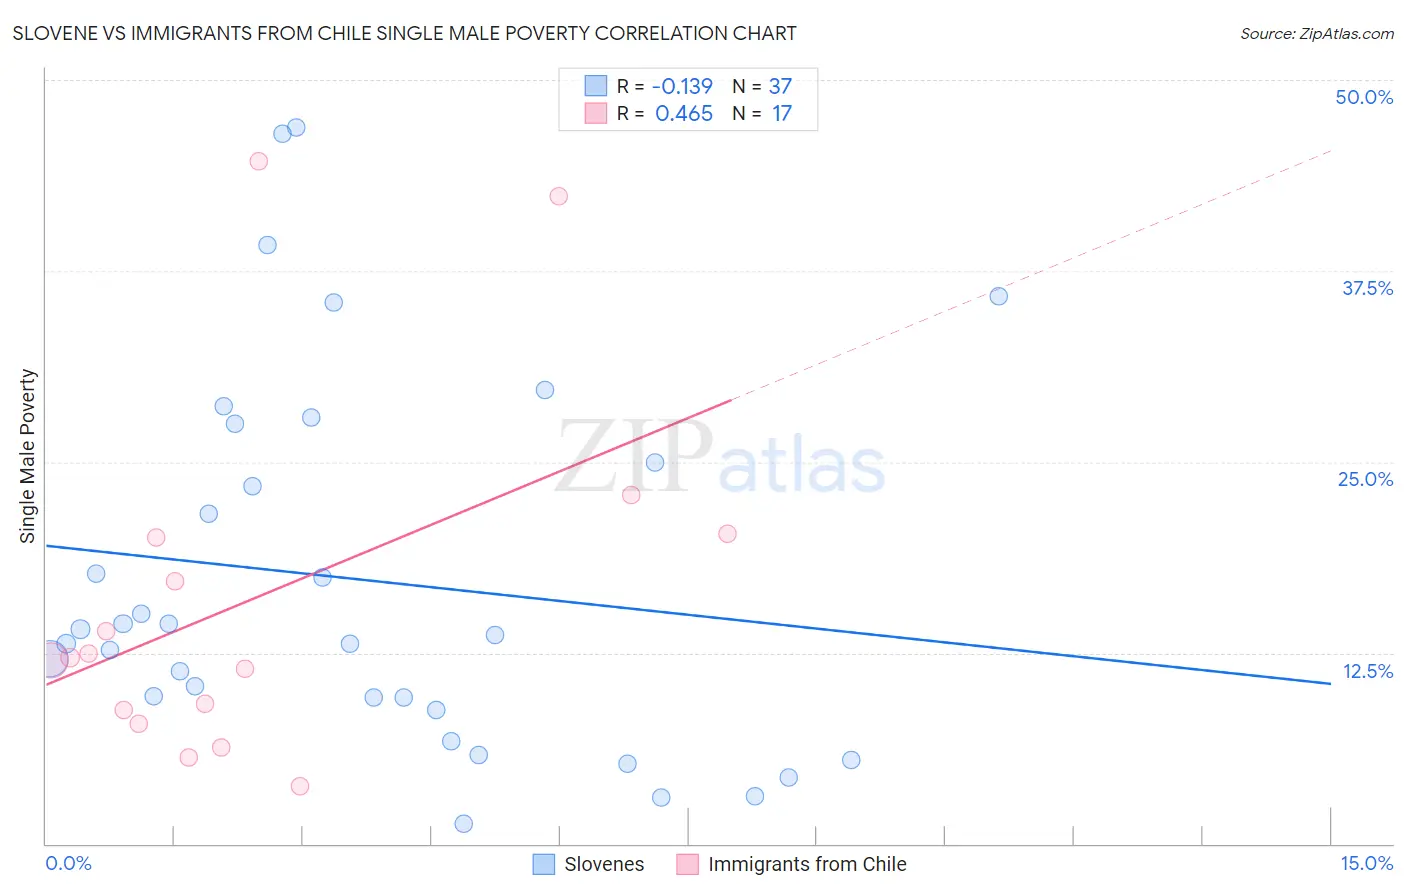
Slovene vs Immigrants from Chile Single Male Poverty Correlation Chart
The statistical analysis conducted on geographies consisting of 233,782,721 people shows a poor negative correlation between the proportion of Slovenes and poverty level among single males in the United States with a correlation coefficient (R) of -0.139 and weighted average of 13.0%. Similarly, the statistical analysis conducted on geographies consisting of 202,893,830 people shows a moderate positive correlation between the proportion of Immigrants from Chile and poverty level among single males in the United States with a correlation coefficient (R) of 0.465 and weighted average of 12.1%, a difference of 7.7%.
Single Male Poverty Correlation Summary
| Measurement | Slovene | Immigrants from Chile |
| Minimum | 1.3% | 3.8% |
| Maximum | 46.9% | 44.7% |
| Range | 45.6% | 40.9% |
| Mean | 17.3% | 15.9% |
| Median | 13.7% | 12.2% |
| Interquartile 25% (IQ1) | 9.2% | 8.3% |
| Interquartile 75% (IQ3) | 26.2% | 20.2% |
| Interquartile Range (IQR) | 17.1% | 11.9% |
| Standard Deviation (Sample) | 12.1% | 11.7% |
| Standard Deviation (Population) | 12.0% | 11.3% |
Similar Demographics by Single Male Poverty
Demographics Similar to Slovenes by Single Male Poverty
In terms of single male poverty, the demographic groups most similar to Slovenes are Trinidadian and Tobagonian (13.0%, a difference of 0.010%), Immigrants from Norway (13.0%, a difference of 0.020%), Lithuanian (13.0%, a difference of 0.040%), Basque (13.0%, a difference of 0.070%), and Immigrants from Bangladesh (13.0%, a difference of 0.10%).
| Demographics | Rating | Rank | Single Male Poverty |
| Immigrants | South Africa | 26.1 /100 | #193 | Fair 13.0% |
| Liberians | 25.2 /100 | #194 | Fair 13.0% |
| Immigrants | England | 23.4 /100 | #195 | Fair 13.0% |
| Immigrants | Grenada | 23.1 /100 | #196 | Fair 13.0% |
| Immigrants | Laos | 23.1 /100 | #197 | Fair 13.0% |
| Lithuanians | 22.1 /100 | #198 | Fair 13.0% |
| Immigrants | Norway | 21.8 /100 | #199 | Fair 13.0% |
| Slovenes | 21.6 /100 | #200 | Fair 13.0% |
| Trinidadians and Tobagonians | 21.4 /100 | #201 | Fair 13.0% |
| Basques | 20.7 /100 | #202 | Fair 13.0% |
| Immigrants | Bangladesh | 20.4 /100 | #203 | Fair 13.0% |
| Estonians | 20.3 /100 | #204 | Fair 13.0% |
| Poles | 19.3 /100 | #205 | Poor 13.0% |
| Northern Europeans | 18.9 /100 | #206 | Poor 13.0% |
| Sudanese | 17.7 /100 | #207 | Poor 13.1% |
Demographics Similar to Immigrants from Chile by Single Male Poverty
In terms of single male poverty, the demographic groups most similar to Immigrants from Chile are Immigrants from Colombia (12.1%, a difference of 0.0%), Immigrants from Czechoslovakia (12.1%, a difference of 0.020%), Immigrants from South America (12.1%, a difference of 0.060%), Armenian (12.1%, a difference of 0.080%), and Turkish (12.1%, a difference of 0.10%).
| Demographics | Rating | Rank | Single Male Poverty |
| Immigrants | Northern Africa | 99.4 /100 | #76 | Exceptional 11.9% |
| Immigrants | Malaysia | 99.2 /100 | #77 | Exceptional 12.0% |
| Immigrants | Venezuela | 99.1 /100 | #78 | Exceptional 12.0% |
| Immigrants | Belgium | 99.0 /100 | #79 | Exceptional 12.0% |
| Armenians | 98.7 /100 | #80 | Exceptional 12.1% |
| Immigrants | South America | 98.7 /100 | #81 | Exceptional 12.1% |
| Immigrants | Colombia | 98.6 /100 | #82 | Exceptional 12.1% |
| Immigrants | Chile | 98.6 /100 | #83 | Exceptional 12.1% |
| Immigrants | Czechoslovakia | 98.6 /100 | #84 | Exceptional 12.1% |
| Turks | 98.5 /100 | #85 | Exceptional 12.1% |
| Immigrants | Israel | 98.5 /100 | #86 | Exceptional 12.1% |
| South Americans | 98.5 /100 | #87 | Exceptional 12.1% |
| Immigrants | Eritrea | 98.5 /100 | #88 | Exceptional 12.1% |
| Immigrants | Ireland | 98.3 /100 | #89 | Exceptional 12.1% |
| South American Indians | 98.3 /100 | #90 | Exceptional 12.1% |