Slovene vs Indian (Asian) Single Male Poverty
COMPARE
Slovene
Indian (Asian)
Single Male Poverty
Single Male Poverty Comparison
Slovenes
Indians (Asian)
13.0%
SINGLE MALE POVERTY
21.6/ 100
METRIC RATING
200th/ 347
METRIC RANK
11.3%
SINGLE MALE POVERTY
100.0/ 100
METRIC RATING
24th/ 347
METRIC RANK
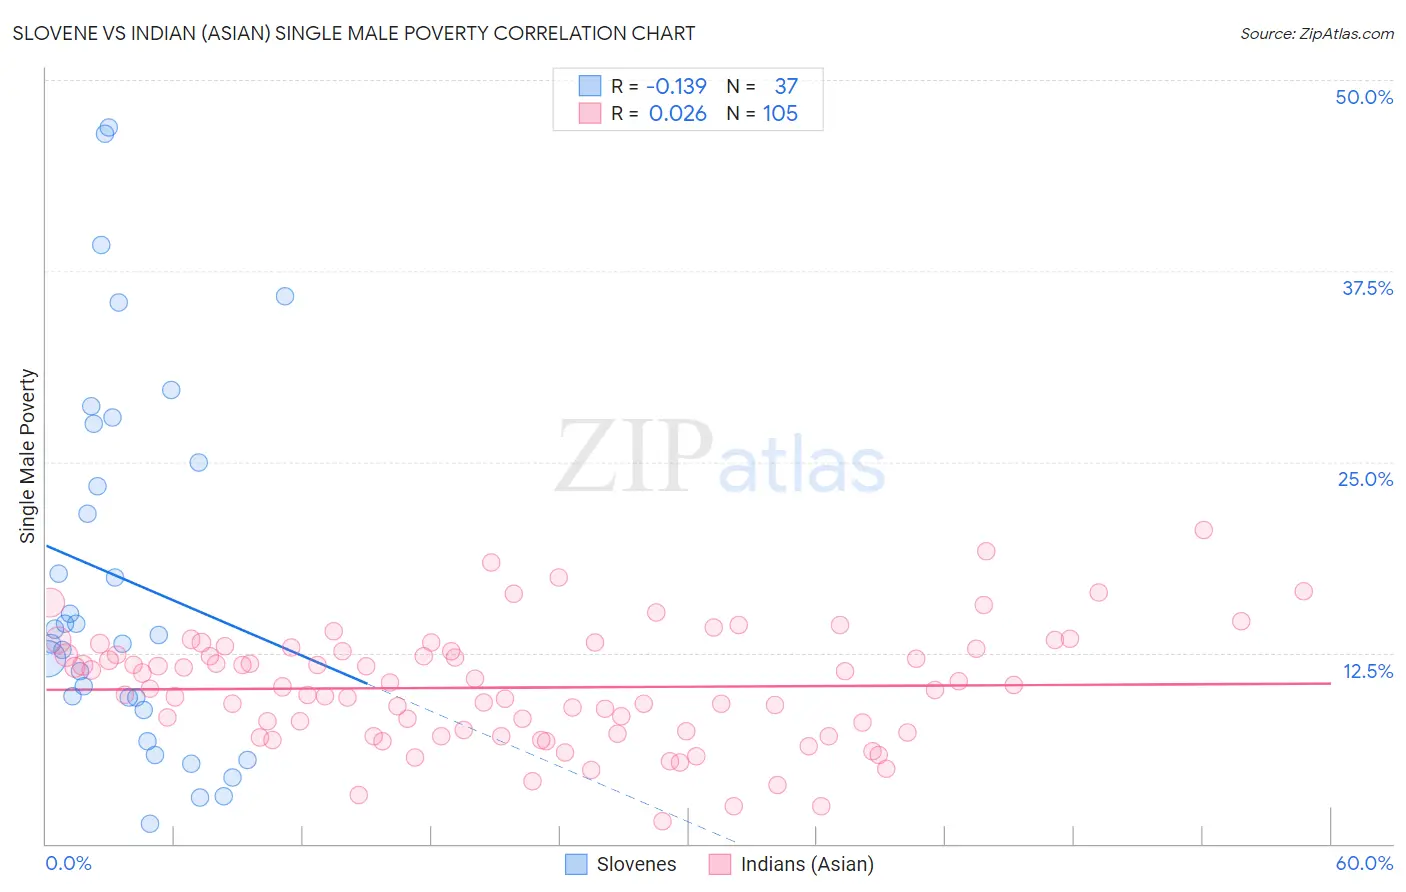
Slovene vs Indian (Asian) Single Male Poverty Correlation Chart
The statistical analysis conducted on geographies consisting of 233,782,721 people shows a poor negative correlation between the proportion of Slovenes and poverty level among single males in the United States with a correlation coefficient (R) of -0.139 and weighted average of 13.0%. Similarly, the statistical analysis conducted on geographies consisting of 425,562,550 people shows no correlation between the proportion of Indians (Asian) and poverty level among single males in the United States with a correlation coefficient (R) of 0.026 and weighted average of 11.3%, a difference of 15.6%.
Single Male Poverty Correlation Summary
| Measurement | Slovene | Indian (Asian) |
| Minimum | 1.3% | 1.5% |
| Maximum | 46.9% | 20.6% |
| Range | 45.6% | 19.1% |
| Mean | 17.3% | 10.2% |
| Median | 13.7% | 10.3% |
| Interquartile 25% (IQ1) | 9.2% | 7.2% |
| Interquartile 75% (IQ3) | 26.2% | 12.7% |
| Interquartile Range (IQR) | 17.1% | 5.5% |
| Standard Deviation (Sample) | 12.1% | 3.8% |
| Standard Deviation (Population) | 12.0% | 3.7% |
Similar Demographics by Single Male Poverty
Demographics Similar to Slovenes by Single Male Poverty
In terms of single male poverty, the demographic groups most similar to Slovenes are Trinidadian and Tobagonian (13.0%, a difference of 0.010%), Immigrants from Norway (13.0%, a difference of 0.020%), Lithuanian (13.0%, a difference of 0.040%), Basque (13.0%, a difference of 0.070%), and Immigrants from Bangladesh (13.0%, a difference of 0.10%).
| Demographics | Rating | Rank | Single Male Poverty |
| Immigrants | South Africa | 26.1 /100 | #193 | Fair 13.0% |
| Liberians | 25.2 /100 | #194 | Fair 13.0% |
| Immigrants | England | 23.4 /100 | #195 | Fair 13.0% |
| Immigrants | Grenada | 23.1 /100 | #196 | Fair 13.0% |
| Immigrants | Laos | 23.1 /100 | #197 | Fair 13.0% |
| Lithuanians | 22.1 /100 | #198 | Fair 13.0% |
| Immigrants | Norway | 21.8 /100 | #199 | Fair 13.0% |
| Slovenes | 21.6 /100 | #200 | Fair 13.0% |
| Trinidadians and Tobagonians | 21.4 /100 | #201 | Fair 13.0% |
| Basques | 20.7 /100 | #202 | Fair 13.0% |
| Immigrants | Bangladesh | 20.4 /100 | #203 | Fair 13.0% |
| Estonians | 20.3 /100 | #204 | Fair 13.0% |
| Poles | 19.3 /100 | #205 | Poor 13.0% |
| Northern Europeans | 18.9 /100 | #206 | Poor 13.0% |
| Sudanese | 17.7 /100 | #207 | Poor 13.1% |
Demographics Similar to Indians (Asian) by Single Male Poverty
In terms of single male poverty, the demographic groups most similar to Indians (Asian) are Maltese (11.3%, a difference of 0.020%), Bolivian (11.2%, a difference of 0.20%), Immigrants from Japan (11.3%, a difference of 0.35%), Immigrants from Pakistan (11.2%, a difference of 0.41%), and Asian (11.2%, a difference of 0.50%).
| Demographics | Rating | Rank | Single Male Poverty |
| Tsimshian | 100.0 /100 | #17 | Exceptional 11.1% |
| Immigrants | Bolivia | 100.0 /100 | #18 | Exceptional 11.1% |
| Immigrants | Moldova | 100.0 /100 | #19 | Exceptional 11.2% |
| Ethiopians | 100.0 /100 | #20 | Exceptional 11.2% |
| Asians | 100.0 /100 | #21 | Exceptional 11.2% |
| Immigrants | Pakistan | 100.0 /100 | #22 | Exceptional 11.2% |
| Bolivians | 100.0 /100 | #23 | Exceptional 11.2% |
| Indians (Asian) | 100.0 /100 | #24 | Exceptional 11.3% |
| Maltese | 100.0 /100 | #25 | Exceptional 11.3% |
| Immigrants | Japan | 100.0 /100 | #26 | Exceptional 11.3% |
| Immigrants | China | 100.0 /100 | #27 | Exceptional 11.4% |
| Immigrants | Asia | 100.0 /100 | #28 | Exceptional 11.4% |
| Immigrants | Egypt | 100.0 /100 | #29 | Exceptional 11.4% |
| Iranians | 100.0 /100 | #30 | Exceptional 11.4% |
| Immigrants | Iran | 100.0 /100 | #31 | Exceptional 11.4% |