Shoshone vs Sierra Leonean Seniors Poverty Over the Age of 65

COMPARE

Shoshone
Race
Ancestry
AfghanAfricanAlaska NativeAlaskan AthabascanAlbanianAleutAlsatianAmericanApacheArabArapahoArgentineanArmenianAssyrian/Chaldean/SyriacAustralianAustrianBahamianBangladeshiBarbadianBasqueBelgianBelizeanBermudanBhutaneseBlackfeetBolivianBrazilianBritishBritish West IndianBulgarianBurmeseCajunCambodianCanadianCape VerdeanCarpatho RusynCelticCentral AmericanCentral American IndianCherokeeCheyenneChickasawChileanChineseChippewaChoctawColombianColvilleComancheCosta RicanCreeCreekCroatianCrowCubanCypriotCzechCzechoslovakianDanishDelawareDominicanDutchDutch West IndianEastern EuropeanEcuadorianEgyptianEnglishEstonianEthiopianEuropeanFijianFilipinoFinnishFrenchFrench American IndianFrench CanadianGermanGerman RussianGhanaianGreekGuamanian/ChamorroGuatemalanGuyaneseHaitianHmongHonduranHopiHoumaHungarianIcelanderIndian (Asian)IndonesianInupiatIranianIraqiIrishIroquoisIsraeliItalianJamaicanJapaneseJordanianKenyanKiowaKoreanLaotianLatvianLebaneseLiberianLithuanianLumbeeLuxembourgerMacedonianMalaysianMalteseMarshalleseMenomineeMexicanMexican American IndianMongolianMoroccanNative HawaiianNavajoNepaleseNew ZealanderNicaraguanNigerianNorthern EuropeanNorwegianOkinawanOsageOttawaPaiutePakistaniPalestinianPanamanianParaguayanPennsylvania GermanPeruvianPimaPolishPortuguesePotawatomiPuebloPuerto RicanPuget Sound SalishRomanianRussianSalvadoranSamoanScandinavianScotch-IrishScottishSeminoleSenegaleseSerbianShoshoneSiouxSlavicSlovakSloveneSomaliSouth AfricanSouth AmericanSouth American IndianSoviet UnionSpaniardSpanishSpanish AmericanSpanish American IndianSri LankanSubsaharan AfricanSudaneseSwedishSwissSyrianTaiwaneseThaiTlingit-HaidaTohono O'OdhamTonganTrinidadian and TobagonianTsimshianTurkishU.S. Virgin IslanderUgandanUkrainianUruguayanUteVenezuelanVietnameseWelshWest IndianYakamaYaquiYugoslavianYumanYup'ikZimbabwean
Immigration
NonimmigrantsImmigrantsAfghanistanAfricaAlbaniaArgentinaArmeniaAsiaAustraliaAustriaBahamasBangladeshBarbadosBelarusBelgiumBelizeBoliviaBosnia and HerzegovinaBrazilBulgariaBurma/MyanmarCabo VerdeCambodiaCameroonCanadaCaribbeanCentral AmericaChileChinaColombiaCongoCosta RicaCroatiaCubaCzechoslovakiaDenmarkDominicaDominican RepublicEastern AfricaEastern AsiaEastern EuropeEcuadorEgyptEl SalvadorEnglandEritreaEthiopiaEuropeFijiFranceGermanyGhanaGreeceGrenadaGuatemalaGuyanaHaitiHondurasHong KongHungaryIndiaIndonesiaIranIraqIrelandIsraelItalyJamaicaJapanJordanKazakhstanKenyaKoreaKuwaitLaosLatin AmericaLatviaLebanonLiberiaLithuaniaMalaysiaMexicoMicronesiaMiddle AfricaMoldovaMoroccoNepalNetherlandsNicaraguaNigeriaNorth AmericaNorth MacedoniaNorthern AfricaNorthern EuropeNorwayOceaniaPakistanPanamaPeruPhilippinesPolandPortugalRomaniaRussiaSaudi ArabiaScotlandSenegalSerbiaSierra LeoneSingaporeSomaliaSouth AfricaSouth AmericaSouth Central AsiaSouth Eastern AsiaSouthern EuropeSpainSri LankaSt. Vincent and the GrenadinesSudanSwedenSwitzerlandSyriaTaiwanThailandTrinidad and TobagoTurkeyUgandaUkraineUruguayUzbekistanVenezuelaVietnamWest IndiesWestern AfricaWestern AsiaWestern EuropeYemenZaireZimbabweAzores
Sierra Leonean
Race
Ancestry
AfghanAfricanAlaska NativeAlaskan AthabascanAlbanianAleutAlsatianAmericanApacheArabArapahoArgentineanArmenianAssyrian/Chaldean/SyriacAustralianAustrianBahamianBangladeshiBarbadianBasqueBelgianBelizeanBermudanBhutaneseBlackfeetBolivianBrazilianBritishBritish West IndianBulgarianBurmeseCajunCambodianCanadianCape VerdeanCarpatho RusynCelticCentral AmericanCentral American IndianCherokeeCheyenneChickasawChileanChineseChippewaChoctawColombianColvilleComancheCosta RicanCreeCreekCroatianCrowCubanCypriotCzechCzechoslovakianDanishDelawareDominicanDutchDutch West IndianEastern EuropeanEcuadorianEgyptianEnglishEstonianEthiopianEuropeanFijianFilipinoFinnishFrenchFrench American IndianFrench CanadianGermanGerman RussianGhanaianGreekGuamanian/ChamorroGuatemalanGuyaneseHaitianHmongHonduranHopiHoumaHungarianIcelanderIndian (Asian)IndonesianInupiatIranianIraqiIrishIroquoisIsraeliItalianJamaicanJapaneseJordanianKenyanKiowaKoreanLaotianLatvianLebaneseLiberianLithuanianLumbeeLuxembourgerMacedonianMalaysianMalteseMarshalleseMenomineeMexicanMexican American IndianMongolianMoroccanNative HawaiianNavajoNepaleseNew ZealanderNicaraguanNigerianNorthern EuropeanNorwegianOkinawanOsageOttawaPaiutePakistaniPalestinianPanamanianParaguayanPennsylvania GermanPeruvianPimaPolishPortuguesePotawatomiPuebloPuerto RicanPuget Sound SalishRomanianRussianSalvadoranSamoanScandinavianScotch-IrishScottishSeminoleSenegaleseSerbianSierra LeoneanSiouxSlavicSlovakSloveneSomaliSouth AfricanSouth AmericanSouth American IndianSoviet UnionSpaniardSpanishSpanish AmericanSpanish American IndianSri LankanSubsaharan AfricanSudaneseSwedishSwissSyrianTaiwaneseThaiTlingit-HaidaTohono O'OdhamTonganTrinidadian and TobagonianTsimshianTurkishU.S. Virgin IslanderUgandanUkrainianUruguayanUteVenezuelanVietnameseWelshWest IndianYakamaYaquiYugoslavianYumanYup'ikZimbabwean
Immigration
NonimmigrantsImmigrantsAfghanistanAfricaAlbaniaArgentinaArmeniaAsiaAustraliaAustriaBahamasBangladeshBarbadosBelarusBelgiumBelizeBoliviaBosnia and HerzegovinaBrazilBulgariaBurma/MyanmarCabo VerdeCambodiaCameroonCanadaCaribbeanCentral AmericaChileChinaColombiaCongoCosta RicaCroatiaCubaCzechoslovakiaDenmarkDominicaDominican RepublicEastern AfricaEastern AsiaEastern EuropeEcuadorEgyptEl SalvadorEnglandEritreaEthiopiaEuropeFijiFranceGermanyGhanaGreeceGrenadaGuatemalaGuyanaHaitiHondurasHong KongHungaryIndiaIndonesiaIranIraqIrelandIsraelItalyJamaicaJapanJordanKazakhstanKenyaKoreaKuwaitLaosLatin AmericaLatviaLebanonLiberiaLithuaniaMalaysiaMexicoMicronesiaMiddle AfricaMoldovaMoroccoNepalNetherlandsNicaraguaNigeriaNorth AmericaNorth MacedoniaNorthern AfricaNorthern EuropeNorwayOceaniaPakistanPanamaPeruPhilippinesPolandPortugalRomaniaRussiaSaudi ArabiaScotlandSenegalSerbiaSierra LeoneSingaporeSomaliaSouth AfricaSouth AmericaSouth Central AsiaSouth Eastern AsiaSouthern EuropeSpainSri LankaSt. Vincent and the GrenadinesSudanSwedenSwitzerlandSyriaTaiwanThailandTrinidad and TobagoTurkeyUgandaUkraineUruguayUzbekistanVenezuelaVietnamWest IndiesWestern AfricaWestern AsiaWestern EuropeYemenZaireZimbabweAzores
Seniors Poverty Over the Age of 65
Income
Poverty
Unemployment
Labor Participation
Family Structure
Vehicle Availability
Education Level
Disability

Seniors Poverty Over the Age of 65 Comparison

Shoshone

Sierra Leoneans

Tragic
Excellent
12.3%
SENIORS POVERTY OVER THE AGE OF 65
0.3/ 100
METRIC RATING
253rd/ 347
METRIC RANK
10.5%
SENIORS POVERTY OVER THE AGE OF 65
86.8/ 100
METRIC RATING
134th/ 347
METRIC RANK

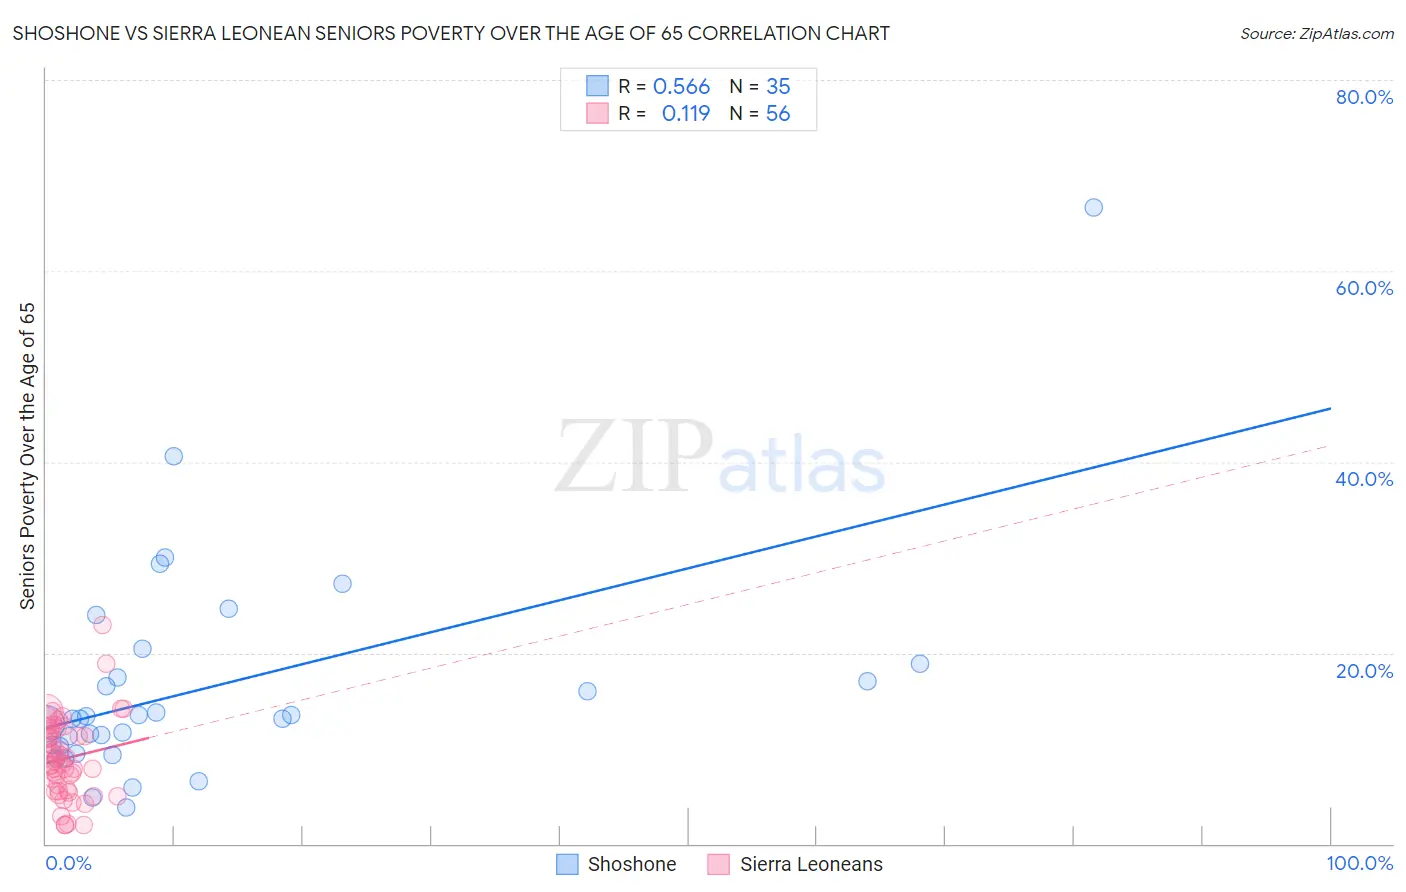
Shoshone vs Sierra Leonean Seniors Poverty Over the Age of 65 Correlation Chart

The statistical analysis conducted on geographies consisting of 66,580,086 people shows a substantial positive correlation between the proportion of Shoshone and poverty level among seniors over the age of 65 in the United States with a correlation coefficient (R) of 0.566 and weighted average of 12.3%. Similarly, the statistical analysis conducted on geographies consisting of 83,269,460 people shows a poor positive correlation between the proportion of Sierra Leoneans and poverty level among seniors over the age of 65 in the United States with a correlation coefficient (R) of 0.119 and weighted average of 10.5%, a difference of 17.8%.
Shoshone vs Sierra Leonean Seniors Poverty Over the Age of 65

Seniors Poverty Over the Age of 65 Correlation Summary

MeasurementShoshoneSierra Leonean
Minimum3.8%1.9%
Maximum66.7%22.9%
Range62.9%21.0%
Mean16.5%9.0%
Median13.1%8.6%
Interquartile 25% (IQ1)10.3%5.5%
Interquartile 75% (IQ3)18.8%11.9%
Interquartile Range (IQR)8.6%6.3%
Standard Deviation (Sample)11.8%4.2%
Standard Deviation (Population)11.6%4.1%

Similar Demographics by Seniors Poverty Over the Age of 65

Demographics Similar to Shoshone by Seniors Poverty Over the Age of 65

In terms of seniors poverty over the age of 65, the demographic groups most similar to Shoshone are Armenian (12.3%, a difference of 0.13%), Immigrants from Cambodia (12.4%, a difference of 0.22%), Somali (12.3%, a difference of 0.24%), Mexican American Indian (12.4%, a difference of 0.34%), and Immigrants from Panama (12.4%, a difference of 0.58%).
DemographicsRating | RankSeniors Poverty Over the Age of 65
Cree
0.7
/100
|
#246
Tragic
12.1%
Japanese
0.6
/100
|
#247
Tragic
12.2%
Spanish Americans
0.6
/100
|
#248
Tragic
12.2%
Ute
0.6
/100
|
#249
Tragic
12.2%
Immigrants | Liberia
0.5
/100
|
#250
Tragic
12.2%
Somalis
0.3
/100
|
#251
Tragic
12.3%
Armenians
0.3
/100
|
#252
Tragic
12.3%
Shoshone
0.3
/100
|
#253
Tragic
12.3%
Immigrants | Cambodia
0.3
/100
|
#254
Tragic
12.4%
Mexican American Indians
0.3
/100
|
#255
Tragic
12.4%
Immigrants | Panama
0.2
/100
|
#256
Tragic
12.4%
Immigrants | Immigrants
0.2
/100
|
#257
Tragic
12.4%
Dutch West Indians
0.2
/100
|
#258
Tragic
12.4%
Ghanaians
0.2
/100
|
#259
Tragic
12.4%
South Americans
0.2
/100
|
#260
Tragic
12.5%

Demographics Similar to Sierra Leoneans by Seniors Poverty Over the Age of 65

In terms of seniors poverty over the age of 65, the demographic groups most similar to Sierra Leoneans are Immigrants from Norway (10.5%, a difference of 0.060%), Immigrants from Serbia (10.5%, a difference of 0.070%), Guamanian/Chamorro (10.5%, a difference of 0.15%), Immigrants from Turkey (10.5%, a difference of 0.19%), and Egyptian (10.5%, a difference of 0.20%).
DemographicsRating | RankSeniors Poverty Over the Age of 65
Cambodians
89.1
/100
|
#127
Excellent
10.4%
Ottawa
88.5
/100
|
#128
Excellent
10.4%
Immigrants | Iran
88.4
/100
|
#129
Excellent
10.4%
Immigrants | Oceania
88.4
/100
|
#130
Excellent
10.4%
Egyptians
87.8
/100
|
#131
Excellent
10.5%
Immigrants | Turkey
87.7
/100
|
#132
Excellent
10.5%
Guamanians/Chamorros
87.5
/100
|
#133
Excellent
10.5%
Sierra Leoneans
86.8
/100
|
#134
Excellent
10.5%
Immigrants | Norway
86.5
/100
|
#135
Excellent
10.5%
Immigrants | Serbia
86.4
/100
|
#136
Excellent
10.5%
Immigrants | Australia
85.1
/100
|
#137
Excellent
10.5%
Immigrants | Latvia
84.7
/100
|
#138
Excellent
10.5%
Portuguese
84.1
/100
|
#139
Excellent
10.5%
Immigrants | Kenya
83.4
/100
|
#140
Excellent
10.5%
Immigrants | Europe
83.3
/100
|
#141
Excellent
10.5%