Immigrants from Italy vs Sierra Leonean Seniors Poverty Over the Age of 65
COMPARE
Immigrants from Italy
Sierra Leonean
Seniors Poverty Over the Age of 65
Seniors Poverty Over the Age of 65 Comparison
Immigrants from Italy
Sierra Leoneans
10.3%
SENIORS POVERTY OVER THE AGE OF 65
92.6/ 100
METRIC RATING
115th/ 347
METRIC RANK
10.5%
SENIORS POVERTY OVER THE AGE OF 65
86.8/ 100
METRIC RATING
134th/ 347
METRIC RANK
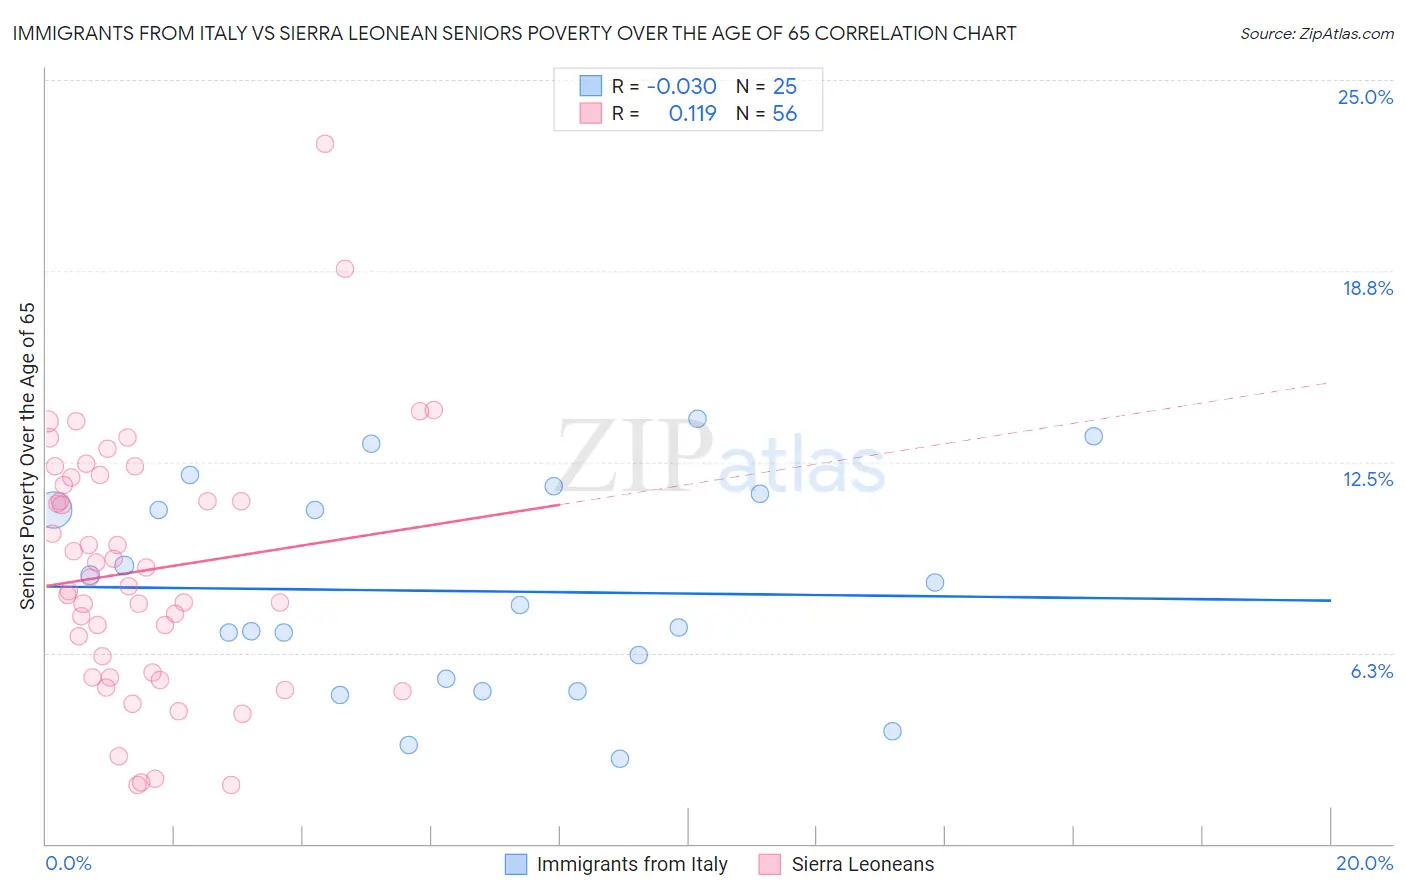
Immigrants from Italy vs Sierra Leonean Seniors Poverty Over the Age of 65 Correlation Chart
The statistical analysis conducted on geographies consisting of 323,572,540 people shows no correlation between the proportion of Immigrants from Italy and poverty level among seniors over the age of 65 in the United States with a correlation coefficient (R) of -0.030 and weighted average of 10.3%. Similarly, the statistical analysis conducted on geographies consisting of 83,269,460 people shows a poor positive correlation between the proportion of Sierra Leoneans and poverty level among seniors over the age of 65 in the United States with a correlation coefficient (R) of 0.119 and weighted average of 10.5%, a difference of 1.5%.
Seniors Poverty Over the Age of 65 Correlation Summary
| Measurement | Immigrants from Italy | Sierra Leonean |
| Minimum | 2.8% | 1.9% |
| Maximum | 13.9% | 22.9% |
| Range | 11.1% | 21.0% |
| Mean | 8.3% | 9.0% |
| Median | 7.8% | 8.6% |
| Interquartile 25% (IQ1) | 5.2% | 5.5% |
| Interquartile 75% (IQ3) | 11.2% | 11.9% |
| Interquartile Range (IQR) | 6.0% | 6.3% |
| Standard Deviation (Sample) | 3.3% | 4.2% |
| Standard Deviation (Population) | 3.3% | 4.1% |
Demographics Similar to Immigrants from Italy and Sierra Leoneans by Seniors Poverty Over the Age of 65
In terms of seniors poverty over the age of 65, the demographic groups most similar to Immigrants from Italy are Immigrants from Denmark (10.3%, a difference of 0.040%), Pakistani (10.3%, a difference of 0.15%), Lebanese (10.3%, a difference of 0.21%), Okinawan (10.4%, a difference of 0.29%), and Immigrants from Western Europe (10.4%, a difference of 0.49%). Similarly, the demographic groups most similar to Sierra Leoneans are Guamanian/Chamorro (10.5%, a difference of 0.15%), Immigrants from Turkey (10.5%, a difference of 0.19%), Egyptian (10.5%, a difference of 0.20%), Immigrants from Oceania (10.4%, a difference of 0.35%), and Immigrants from Iran (10.4%, a difference of 0.36%).
| Demographics | Rating | Rank | Seniors Poverty Over the Age of 65 |
| Immigrants | Denmark | 92.7 /100 | #114 | Exceptional 10.3% |
| Immigrants | Italy | 92.6 /100 | #115 | Exceptional 10.3% |
| Pakistanis | 92.2 /100 | #116 | Exceptional 10.3% |
| Lebanese | 92.0 /100 | #117 | Exceptional 10.3% |
| Okinawans | 91.7 /100 | #118 | Exceptional 10.4% |
| Immigrants | Western Europe | 91.1 /100 | #119 | Exceptional 10.4% |
| Immigrants | Bosnia and Herzegovina | 90.8 /100 | #120 | Exceptional 10.4% |
| Immigrants | Iraq | 90.7 /100 | #121 | Exceptional 10.4% |
| Immigrants | Moldova | 90.7 /100 | #122 | Exceptional 10.4% |
| Hmong | 90.0 /100 | #123 | Exceptional 10.4% |
| Asians | 89.9 /100 | #124 | Excellent 10.4% |
| Immigrants | Philippines | 89.4 /100 | #125 | Excellent 10.4% |
| Immigrants | Hungary | 89.1 /100 | #126 | Excellent 10.4% |
| Cambodians | 89.1 /100 | #127 | Excellent 10.4% |
| Ottawa | 88.5 /100 | #128 | Excellent 10.4% |
| Immigrants | Iran | 88.4 /100 | #129 | Excellent 10.4% |
| Immigrants | Oceania | 88.4 /100 | #130 | Excellent 10.4% |
| Egyptians | 87.8 /100 | #131 | Excellent 10.5% |
| Immigrants | Turkey | 87.7 /100 | #132 | Excellent 10.5% |
| Guamanians/Chamorros | 87.5 /100 | #133 | Excellent 10.5% |
| Sierra Leoneans | 86.8 /100 | #134 | Excellent 10.5% |