Senegalese vs Immigrants from Australia Disability Age Over 75
COMPARE
Senegalese
Immigrants from Australia
Disability Age Over 75
Disability Age Over 75 Comparison
Senegalese
Immigrants from Australia
47.9%
DISABILITY AGE OVER 75
10.7/ 100
METRIC RATING
215th/ 347
METRIC RANK
45.5%
DISABILITY AGE OVER 75
99.9/ 100
METRIC RATING
32nd/ 347
METRIC RANK
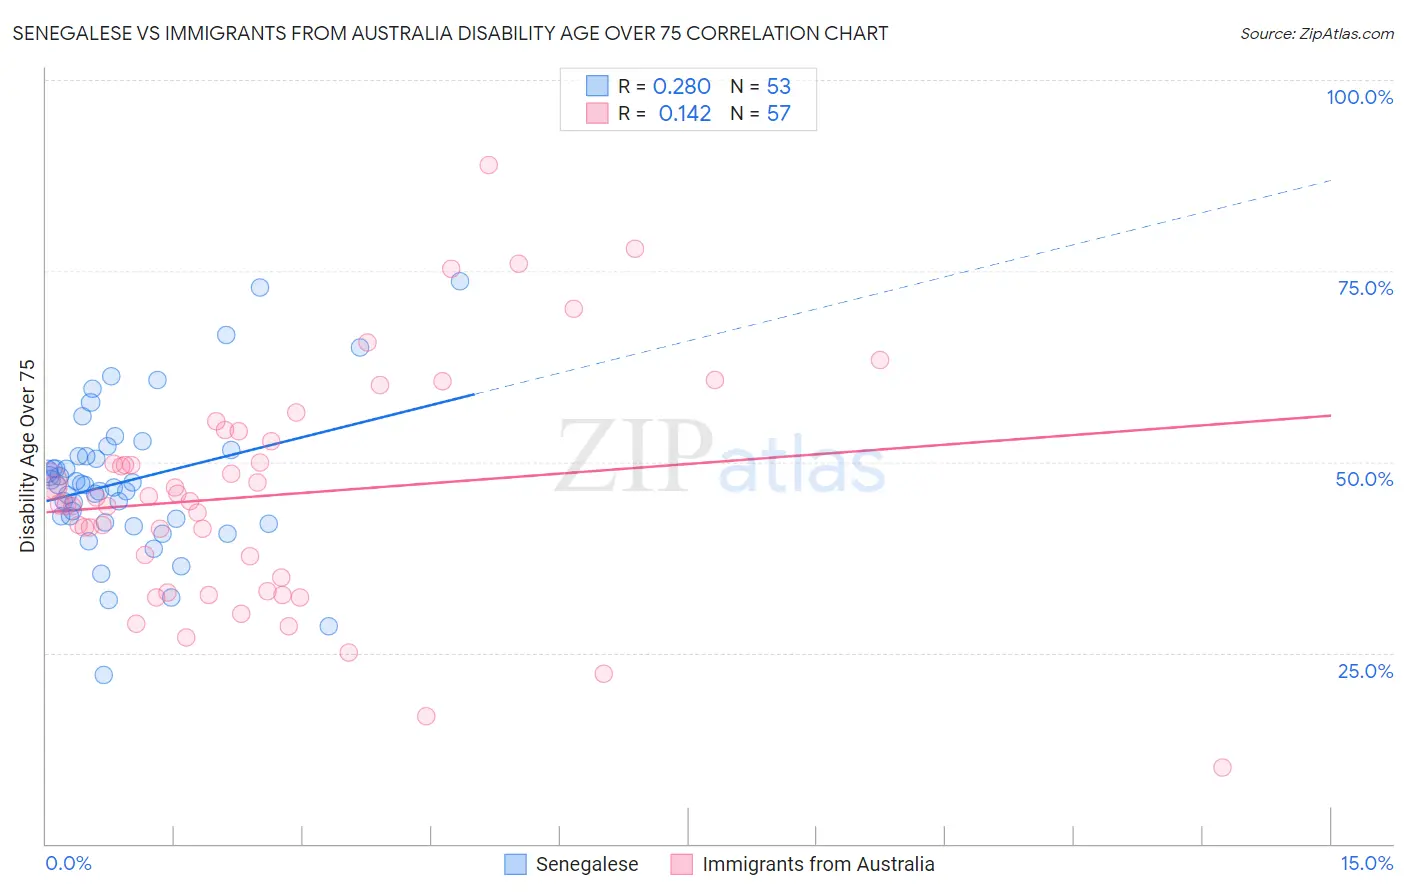
Senegalese vs Immigrants from Australia Disability Age Over 75 Correlation Chart
The statistical analysis conducted on geographies consisting of 78,092,489 people shows a weak positive correlation between the proportion of Senegalese and percentage of population with a disability over the age of 75 in the United States with a correlation coefficient (R) of 0.280 and weighted average of 47.9%. Similarly, the statistical analysis conducted on geographies consisting of 226,989,028 people shows a poor positive correlation between the proportion of Immigrants from Australia and percentage of population with a disability over the age of 75 in the United States with a correlation coefficient (R) of 0.142 and weighted average of 45.5%, a difference of 5.3%.
Disability Age Over 75 Correlation Summary
| Measurement | Senegalese | Immigrants from Australia |
| Minimum | 22.2% | 10.0% |
| Maximum | 73.6% | 88.9% |
| Range | 51.4% | 78.9% |
| Mean | 47.5% | 45.6% |
| Median | 47.0% | 44.8% |
| Interquartile 25% (IQ1) | 42.3% | 34.0% |
| Interquartile 75% (IQ3) | 51.2% | 53.3% |
| Interquartile Range (IQR) | 8.9% | 19.4% |
| Standard Deviation (Sample) | 9.8% | 15.1% |
| Standard Deviation (Population) | 9.7% | 15.0% |
Similar Demographics by Disability Age Over 75
Demographics Similar to Senegalese by Disability Age Over 75
In terms of disability age over 75, the demographic groups most similar to Senegalese are Immigrants from Barbados (47.9%, a difference of 0.0%), Immigrants from Panama (47.9%, a difference of 0.030%), Laotian (47.9%, a difference of 0.050%), Panamanian (47.9%, a difference of 0.060%), and Immigrants from Burma/Myanmar (47.9%, a difference of 0.060%).
| Demographics | Rating | Rank | Disability Age Over 75 |
| Immigrants | Senegal | 16.9 /100 | #208 | Poor 47.8% |
| Immigrants | Indonesia | 14.2 /100 | #209 | Poor 47.8% |
| Vietnamese | 11.9 /100 | #210 | Poor 47.9% |
| Panamanians | 11.8 /100 | #211 | Poor 47.9% |
| Immigrants | Burma/Myanmar | 11.7 /100 | #212 | Poor 47.9% |
| Laotians | 11.5 /100 | #213 | Poor 47.9% |
| Immigrants | Barbados | 10.7 /100 | #214 | Poor 47.9% |
| Senegalese | 10.7 /100 | #215 | Poor 47.9% |
| Immigrants | Panama | 10.2 /100 | #216 | Poor 47.9% |
| Immigrants | Grenada | 9.4 /100 | #217 | Tragic 47.9% |
| Immigrants | Western Africa | 8.3 /100 | #218 | Tragic 48.0% |
| Immigrants | Western Asia | 7.5 /100 | #219 | Tragic 48.0% |
| Bahamians | 7.4 /100 | #220 | Tragic 48.0% |
| Immigrants | Oceania | 7.3 /100 | #221 | Tragic 48.0% |
| Barbadians | 6.8 /100 | #222 | Tragic 48.0% |
Demographics Similar to Immigrants from Australia by Disability Age Over 75
In terms of disability age over 75, the demographic groups most similar to Immigrants from Australia are Immigrants from Bulgaria (45.5%, a difference of 0.030%), Immigrants from Croatia (45.5%, a difference of 0.060%), Immigrants from Denmark (45.4%, a difference of 0.10%), Russian (45.5%, a difference of 0.10%), and Norwegian (45.5%, a difference of 0.10%).
| Demographics | Rating | Rank | Disability Age Over 75 |
| Immigrants | Bolivia | 99.9 /100 | #25 | Exceptional 45.4% |
| Macedonians | 99.9 /100 | #26 | Exceptional 45.4% |
| Immigrants | Poland | 99.9 /100 | #27 | Exceptional 45.4% |
| Thais | 99.9 /100 | #28 | Exceptional 45.4% |
| Filipinos | 99.9 /100 | #29 | Exceptional 45.4% |
| Immigrants | Denmark | 99.9 /100 | #30 | Exceptional 45.4% |
| Immigrants | Bulgaria | 99.9 /100 | #31 | Exceptional 45.5% |
| Immigrants | Australia | 99.9 /100 | #32 | Exceptional 45.5% |
| Immigrants | Croatia | 99.9 /100 | #33 | Exceptional 45.5% |
| Russians | 99.9 /100 | #34 | Exceptional 45.5% |
| Norwegians | 99.9 /100 | #35 | Exceptional 45.5% |
| Immigrants | Taiwan | 99.9 /100 | #36 | Exceptional 45.5% |
| South Africans | 99.9 /100 | #37 | Exceptional 45.5% |
| Italians | 99.9 /100 | #38 | Exceptional 45.6% |
| Estonians | 99.9 /100 | #39 | Exceptional 45.6% |