Seminole vs South American Indian Single Father Poverty
COMPARE
Seminole
South American Indian
Single Father Poverty
Single Father Poverty Comparison
Seminole
South American Indians
18.1%
SINGLE FATHER POVERTY
0.0/ 100
METRIC RATING
296th/ 347
METRIC RANK
15.7%
SINGLE FATHER POVERTY
96.2/ 100
METRIC RATING
103rd/ 347
METRIC RANK
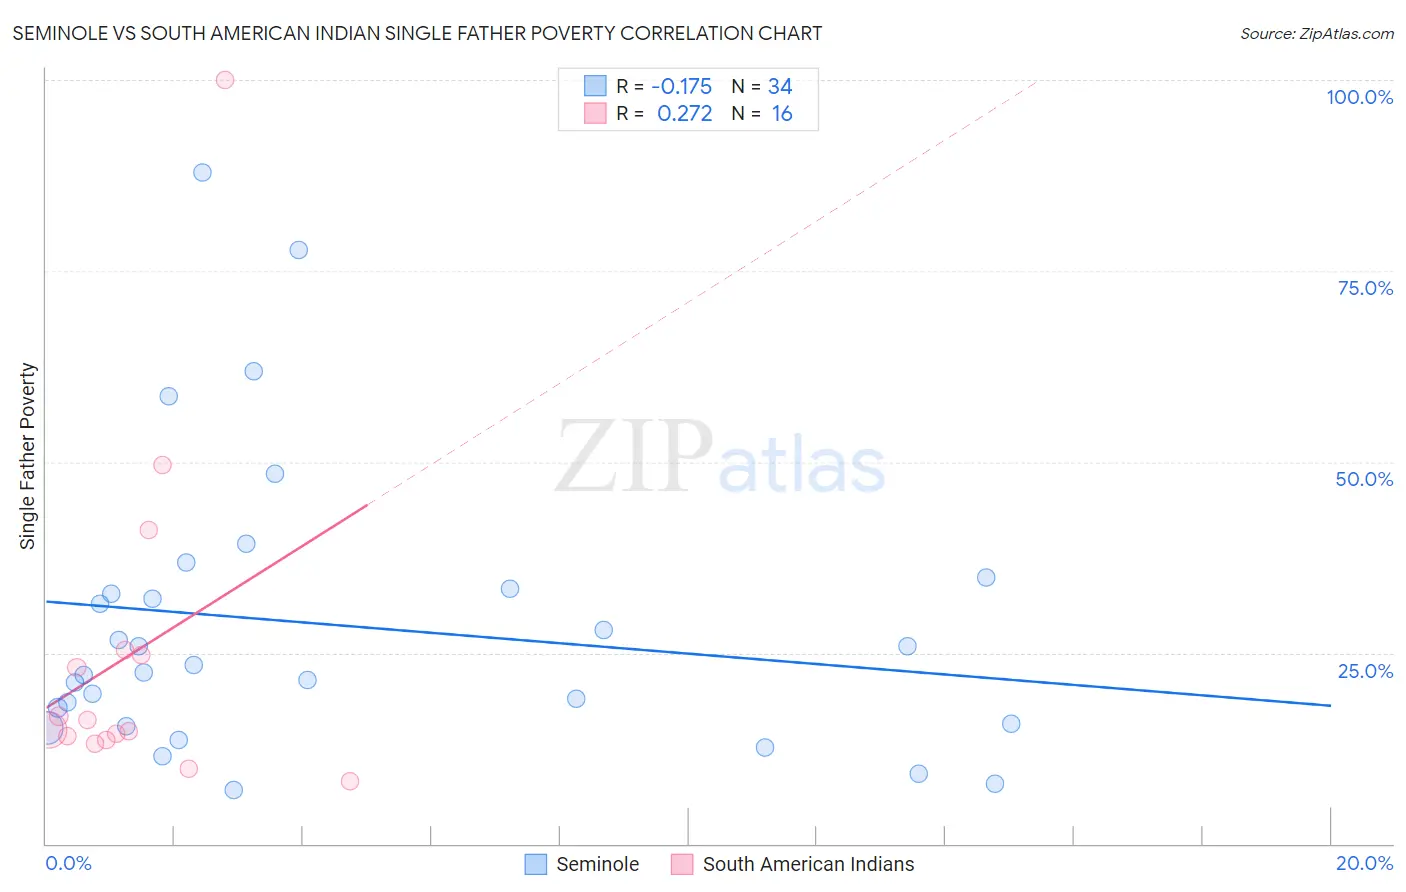
Seminole vs South American Indian Single Father Poverty Correlation Chart
The statistical analysis conducted on geographies consisting of 108,241,513 people shows a poor negative correlation between the proportion of Seminole and poverty level among single fathers in the United States with a correlation coefficient (R) of -0.175 and weighted average of 18.1%. Similarly, the statistical analysis conducted on geographies consisting of 144,417,675 people shows a weak positive correlation between the proportion of South American Indians and poverty level among single fathers in the United States with a correlation coefficient (R) of 0.272 and weighted average of 15.7%, a difference of 15.4%.
Single Father Poverty Correlation Summary
| Measurement | Seminole | South American Indian |
| Minimum | 7.0% | 8.2% |
| Maximum | 87.9% | 100.0% |
| Range | 80.9% | 91.8% |
| Mean | 28.7% | 25.0% |
| Median | 22.9% | 15.6% |
| Interquartile 25% (IQ1) | 15.8% | 13.8% |
| Interquartile 75% (IQ3) | 33.3% | 25.0% |
| Interquartile Range (IQR) | 17.5% | 11.2% |
| Standard Deviation (Sample) | 18.9% | 22.9% |
| Standard Deviation (Population) | 18.6% | 22.2% |
Similar Demographics by Single Father Poverty
Demographics Similar to Seminole by Single Father Poverty
In terms of single father poverty, the demographic groups most similar to Seminole are Yakama (18.1%, a difference of 0.10%), U.S. Virgin Islander (18.1%, a difference of 0.17%), Alaska Native (18.1%, a difference of 0.19%), French (18.2%, a difference of 0.21%), and Immigrants from Bahamas (18.1%, a difference of 0.30%).
| Demographics | Rating | Rank | Single Father Poverty |
| Irish | 0.0 /100 | #289 | Tragic 18.0% |
| West Indians | 0.0 /100 | #290 | Tragic 18.0% |
| Alaskan Athabascans | 0.0 /100 | #291 | Tragic 18.1% |
| Immigrants | Bahamas | 0.0 /100 | #292 | Tragic 18.1% |
| Alaska Natives | 0.0 /100 | #293 | Tragic 18.1% |
| U.S. Virgin Islanders | 0.0 /100 | #294 | Tragic 18.1% |
| Yakama | 0.0 /100 | #295 | Tragic 18.1% |
| Seminole | 0.0 /100 | #296 | Tragic 18.1% |
| French | 0.0 /100 | #297 | Tragic 18.2% |
| Africans | 0.0 /100 | #298 | Tragic 18.3% |
| Whites/Caucasians | 0.0 /100 | #299 | Tragic 18.4% |
| Immigrants | Dominican Republic | 0.0 /100 | #300 | Tragic 18.4% |
| Hungarians | 0.0 /100 | #301 | Tragic 18.5% |
| Comanche | 0.0 /100 | #302 | Tragic 18.5% |
| Celtics | 0.0 /100 | #303 | Tragic 18.5% |
Demographics Similar to South American Indians by Single Father Poverty
In terms of single father poverty, the demographic groups most similar to South American Indians are Australian (15.7%, a difference of 0.020%), Immigrants from Australia (15.7%, a difference of 0.030%), Chilean (15.7%, a difference of 0.060%), Immigrants from Poland (15.7%, a difference of 0.11%), and Native Hawaiian (15.7%, a difference of 0.12%).
| Demographics | Rating | Rank | Single Father Poverty |
| Immigrants | Belgium | 98.1 /100 | #96 | Exceptional 15.6% |
| Yaqui | 98.1 /100 | #97 | Exceptional 15.6% |
| Zimbabweans | 98.1 /100 | #98 | Exceptional 15.6% |
| Immigrants | Middle Africa | 97.4 /100 | #99 | Exceptional 15.6% |
| Immigrants | Chile | 96.9 /100 | #100 | Exceptional 15.7% |
| Fijians | 96.8 /100 | #101 | Exceptional 15.7% |
| Chileans | 96.4 /100 | #102 | Exceptional 15.7% |
| South American Indians | 96.2 /100 | #103 | Exceptional 15.7% |
| Australians | 96.1 /100 | #104 | Exceptional 15.7% |
| Immigrants | Australia | 96.1 /100 | #105 | Exceptional 15.7% |
| Immigrants | Poland | 95.8 /100 | #106 | Exceptional 15.7% |
| Native Hawaiians | 95.8 /100 | #107 | Exceptional 15.7% |
| Pakistanis | 95.7 /100 | #108 | Exceptional 15.7% |
| Turks | 95.1 /100 | #109 | Exceptional 15.8% |
| Immigrants | Africa | 95.1 /100 | #110 | Exceptional 15.8% |