Scotch-Irish vs Aleut Female Poverty Among 25-34 Year Olds
COMPARE
Scotch-Irish
Aleut
Female Poverty Among 25-34 Year Olds
Female Poverty Among 25-34 Year Olds Comparison
Scotch-Irish
Aleuts
14.8%
FEMALE POVERTY AMONG 25-34 YEAR OLDS
1.2/ 100
METRIC RATING
241st/ 347
METRIC RANK
16.1%
FEMALE POVERTY AMONG 25-34 YEAR OLDS
0.0/ 100
METRIC RATING
282nd/ 347
METRIC RANK
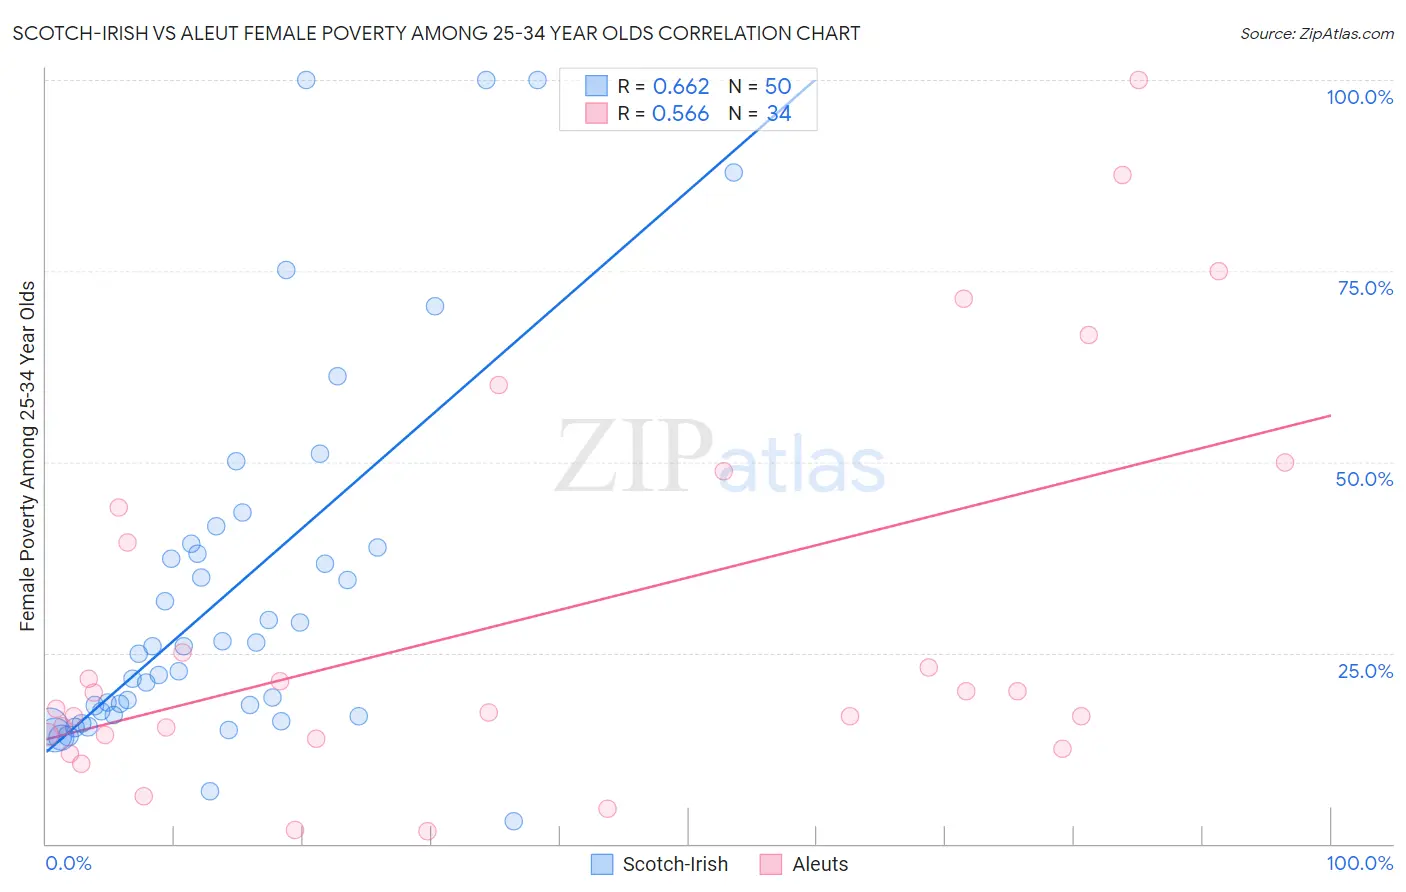
Scotch-Irish vs Aleut Female Poverty Among 25-34 Year Olds Correlation Chart
The statistical analysis conducted on geographies consisting of 529,538,940 people shows a significant positive correlation between the proportion of Scotch-Irish and poverty level among females between the ages 25 and 34 in the United States with a correlation coefficient (R) of 0.662 and weighted average of 14.8%. Similarly, the statistical analysis conducted on geographies consisting of 61,505,480 people shows a substantial positive correlation between the proportion of Aleuts and poverty level among females between the ages 25 and 34 in the United States with a correlation coefficient (R) of 0.566 and weighted average of 16.1%, a difference of 8.9%.
Female Poverty Among 25-34 Year Olds Correlation Summary
| Measurement | Scotch-Irish | Aleut |
| Minimum | 2.9% | 1.6% |
| Maximum | 100.0% | 100.0% |
| Range | 97.1% | 98.4% |
| Mean | 33.1% | 29.4% |
| Median | 25.3% | 18.7% |
| Interquartile 25% (IQ1) | 16.8% | 14.2% |
| Interquartile 75% (IQ3) | 38.8% | 44.1% |
| Interquartile Range (IQR) | 22.0% | 29.8% |
| Standard Deviation (Sample) | 24.2% | 25.6% |
| Standard Deviation (Population) | 24.0% | 25.2% |
Similar Demographics by Female Poverty Among 25-34 Year Olds
Demographics Similar to Scotch-Irish by Female Poverty Among 25-34 Year Olds
In terms of female poverty among 25-34 year olds, the demographic groups most similar to Scotch-Irish are Barbadian (14.8%, a difference of 0.0%), Immigrants from Nicaragua (14.8%, a difference of 0.040%), Immigrants from Bangladesh (14.8%, a difference of 0.040%), Immigrants from Middle Africa (14.8%, a difference of 0.22%), and Immigrants from Grenada (14.7%, a difference of 0.26%).
| Demographics | Rating | Rank | Female Poverty Among 25-34 Year Olds |
| Cubans | 1.6 /100 | #234 | Tragic 14.7% |
| Immigrants | Jamaica | 1.4 /100 | #235 | Tragic 14.7% |
| Salvadorans | 1.4 /100 | #236 | Tragic 14.7% |
| Immigrants | Ghana | 1.4 /100 | #237 | Tragic 14.7% |
| Alsatians | 1.4 /100 | #238 | Tragic 14.7% |
| Malaysians | 1.4 /100 | #239 | Tragic 14.7% |
| Immigrants | Grenada | 1.3 /100 | #240 | Tragic 14.7% |
| Scotch-Irish | 1.2 /100 | #241 | Tragic 14.8% |
| Barbadians | 1.2 /100 | #242 | Tragic 14.8% |
| Immigrants | Nicaragua | 1.1 /100 | #243 | Tragic 14.8% |
| Immigrants | Bangladesh | 1.1 /100 | #244 | Tragic 14.8% |
| Immigrants | Middle Africa | 1.0 /100 | #245 | Tragic 14.8% |
| Jamaicans | 1.0 /100 | #246 | Tragic 14.8% |
| German Russians | 0.8 /100 | #247 | Tragic 14.9% |
| Immigrants | Western Africa | 0.8 /100 | #248 | Tragic 14.9% |
Demographics Similar to Aleuts by Female Poverty Among 25-34 Year Olds
In terms of female poverty among 25-34 year olds, the demographic groups most similar to Aleuts are Bahamian (16.1%, a difference of 0.030%), Immigrants from Latin America (16.0%, a difference of 0.66%), Shoshone (16.2%, a difference of 0.87%), Bangladeshi (15.9%, a difference of 1.2%), and French American Indian (15.9%, a difference of 1.3%).
| Demographics | Rating | Rank | Female Poverty Among 25-34 Year Olds |
| Immigrants | Azores | 0.0 /100 | #275 | Tragic 15.8% |
| Immigrants | Zaire | 0.0 /100 | #276 | Tragic 15.8% |
| Immigrants | Micronesia | 0.0 /100 | #277 | Tragic 15.8% |
| French American Indians | 0.0 /100 | #278 | Tragic 15.9% |
| Fijians | 0.0 /100 | #279 | Tragic 15.9% |
| Bangladeshis | 0.0 /100 | #280 | Tragic 15.9% |
| Immigrants | Latin America | 0.0 /100 | #281 | Tragic 16.0% |
| Aleuts | 0.0 /100 | #282 | Tragic 16.1% |
| Bahamians | 0.0 /100 | #283 | Tragic 16.1% |
| Shoshone | 0.0 /100 | #284 | Tragic 16.2% |
| Immigrants | Bahamas | 0.0 /100 | #285 | Tragic 16.3% |
| Cape Verdeans | 0.0 /100 | #286 | Tragic 16.3% |
| Americans | 0.0 /100 | #287 | Tragic 16.4% |
| Guatemalans | 0.0 /100 | #288 | Tragic 16.4% |
| Osage | 0.0 /100 | #289 | Tragic 16.4% |