Scandinavian vs Iraqi Child Poverty Under the Age of 16
COMPARE
Scandinavian
Iraqi
Child Poverty Under the Age of 16
Child Poverty Under the Age of 16 Comparison
Scandinavians
Iraqis
14.1%
CHILD POVERTY UNDER THE AGE OF 16
98.6/ 100
METRIC RATING
59th/ 347
METRIC RANK
17.5%
CHILD POVERTY UNDER THE AGE OF 16
5.9/ 100
METRIC RATING
214th/ 347
METRIC RANK
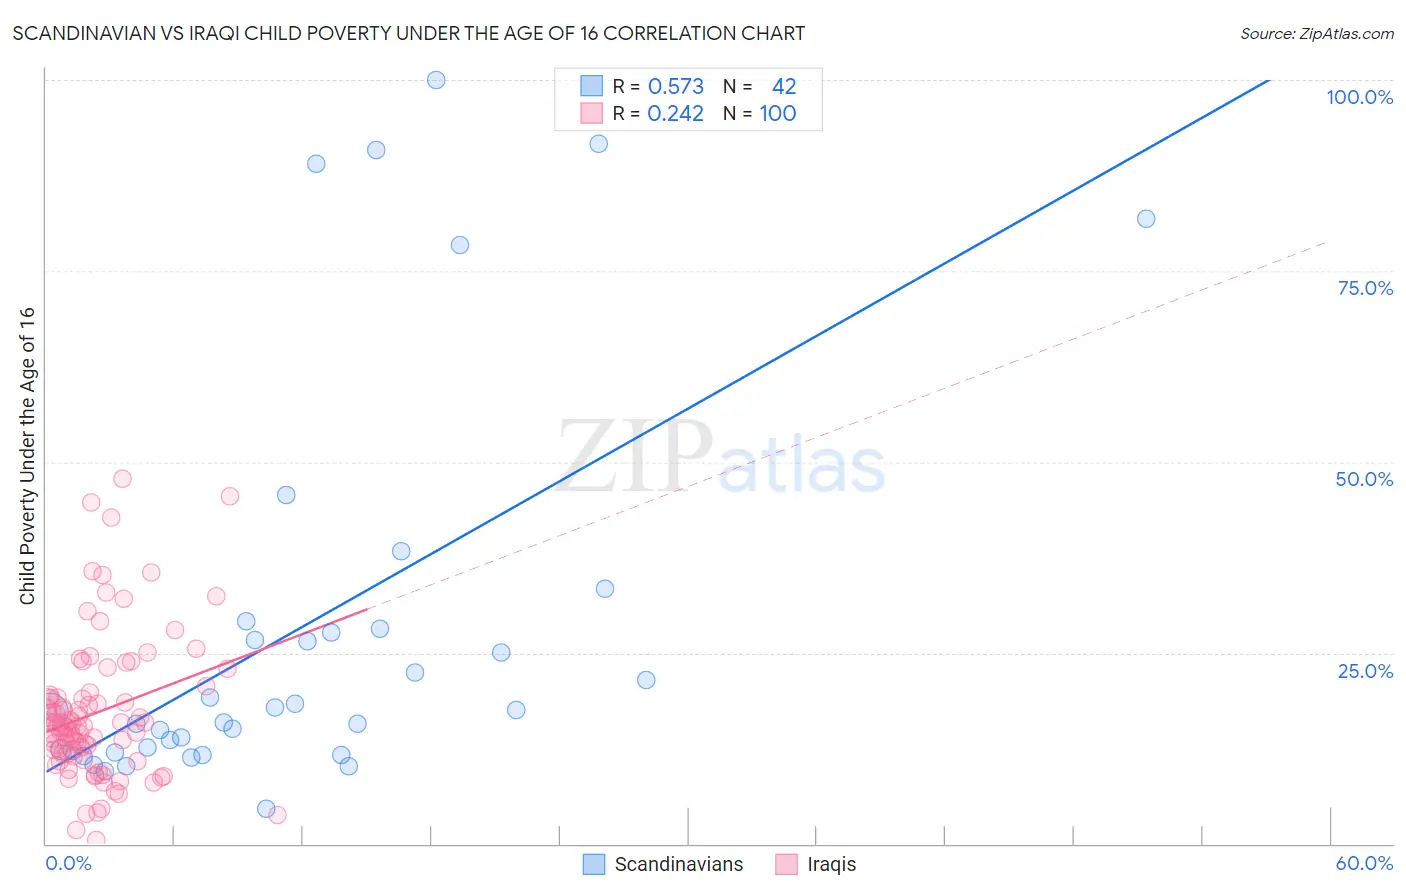
Scandinavian vs Iraqi Child Poverty Under the Age of 16 Correlation Chart
The statistical analysis conducted on geographies consisting of 465,879,873 people shows a substantial positive correlation between the proportion of Scandinavians and poverty level among children under the age of 16 in the United States with a correlation coefficient (R) of 0.573 and weighted average of 14.1%. Similarly, the statistical analysis conducted on geographies consisting of 170,217,272 people shows a weak positive correlation between the proportion of Iraqis and poverty level among children under the age of 16 in the United States with a correlation coefficient (R) of 0.242 and weighted average of 17.5%, a difference of 24.2%.
Child Poverty Under the Age of 16 Correlation Summary
| Measurement | Scandinavian | Iraqi |
| Minimum | 4.7% | 0.44% |
| Maximum | 100.0% | 47.7% |
| Range | 95.3% | 47.3% |
| Mean | 28.4% | 17.2% |
| Median | 17.4% | 15.4% |
| Interquartile 25% (IQ1) | 12.2% | 11.8% |
| Interquartile 75% (IQ3) | 28.2% | 19.2% |
| Interquartile Range (IQR) | 16.0% | 7.4% |
| Standard Deviation (Sample) | 26.4% | 9.3% |
| Standard Deviation (Population) | 26.0% | 9.2% |
Similar Demographics by Child Poverty Under the Age of 16
Demographics Similar to Scandinavians by Child Poverty Under the Age of 16
In terms of child poverty under the age of 16, the demographic groups most similar to Scandinavians are Immigrants from Pakistan (14.1%, a difference of 0.010%), Immigrants from Belgium (14.1%, a difference of 0.030%), Immigrants from Serbia (14.1%, a difference of 0.12%), Immigrants from Austria (14.2%, a difference of 0.19%), and Immigrants from Sweden (14.2%, a difference of 0.22%).
| Demographics | Rating | Rank | Child Poverty Under the Age of 16 |
| Poles | 98.9 /100 | #52 | Exceptional 14.0% |
| Immigrants | Israel | 98.8 /100 | #53 | Exceptional 14.1% |
| Tsimshian | 98.8 /100 | #54 | Exceptional 14.1% |
| Immigrants | Indonesia | 98.7 /100 | #55 | Exceptional 14.1% |
| Immigrants | Serbia | 98.7 /100 | #56 | Exceptional 14.1% |
| Immigrants | Belgium | 98.6 /100 | #57 | Exceptional 14.1% |
| Immigrants | Pakistan | 98.6 /100 | #58 | Exceptional 14.1% |
| Scandinavians | 98.6 /100 | #59 | Exceptional 14.1% |
| Immigrants | Austria | 98.5 /100 | #60 | Exceptional 14.2% |
| Immigrants | Sweden | 98.5 /100 | #61 | Exceptional 14.2% |
| Zimbabweans | 98.5 /100 | #62 | Exceptional 14.2% |
| Immigrants | Europe | 98.4 /100 | #63 | Exceptional 14.2% |
| Immigrants | Romania | 98.3 /100 | #64 | Exceptional 14.2% |
| Immigrants | Philippines | 98.2 /100 | #65 | Exceptional 14.3% |
| Slovenes | 98.1 /100 | #66 | Exceptional 14.3% |
Demographics Similar to Iraqis by Child Poverty Under the Age of 16
In terms of child poverty under the age of 16, the demographic groups most similar to Iraqis are Malaysian (17.5%, a difference of 0.020%), Immigrants from the Azores (17.5%, a difference of 0.12%), Sierra Leonean (17.6%, a difference of 0.13%), Immigrants (17.5%, a difference of 0.29%), and Immigrants from Thailand (17.5%, a difference of 0.31%).
| Demographics | Rating | Rank | Child Poverty Under the Age of 16 |
| German Russians | 8.6 /100 | #207 | Tragic 17.4% |
| Pennsylvania Germans | 7.5 /100 | #208 | Tragic 17.4% |
| Panamanians | 6.9 /100 | #209 | Tragic 17.5% |
| Alaskan Athabascans | 6.9 /100 | #210 | Tragic 17.5% |
| Immigrants | Thailand | 6.6 /100 | #211 | Tragic 17.5% |
| Immigrants | Immigrants | 6.5 /100 | #212 | Tragic 17.5% |
| Immigrants | Azores | 6.2 /100 | #213 | Tragic 17.5% |
| Iraqis | 5.9 /100 | #214 | Tragic 17.5% |
| Malaysians | 5.9 /100 | #215 | Tragic 17.5% |
| Sierra Leoneans | 5.7 /100 | #216 | Tragic 17.6% |
| Immigrants | Eastern Africa | 5.3 /100 | #217 | Tragic 17.6% |
| Moroccans | 5.3 /100 | #218 | Tragic 17.6% |
| Japanese | 4.7 /100 | #219 | Tragic 17.7% |
| Immigrants | Panama | 4.1 /100 | #220 | Tragic 17.7% |
| Cubans | 3.7 /100 | #221 | Tragic 17.8% |