Scandinavian vs Immigrants from Malaysia Female Poverty Among 18-24 Year Olds
COMPARE
Scandinavian
Immigrants from Malaysia
Female Poverty Among 18-24 Year Olds
Female Poverty Among 18-24 Year Olds Comparison
Scandinavians
Immigrants from Malaysia
20.3%
FEMALE POVERTY AMONG 18-24 YEAR OLDS
34.6/ 100
METRIC RATING
188th/ 347
METRIC RANK
20.5%
FEMALE POVERTY AMONG 18-24 YEAR OLDS
17.2/ 100
METRIC RATING
203rd/ 347
METRIC RANK
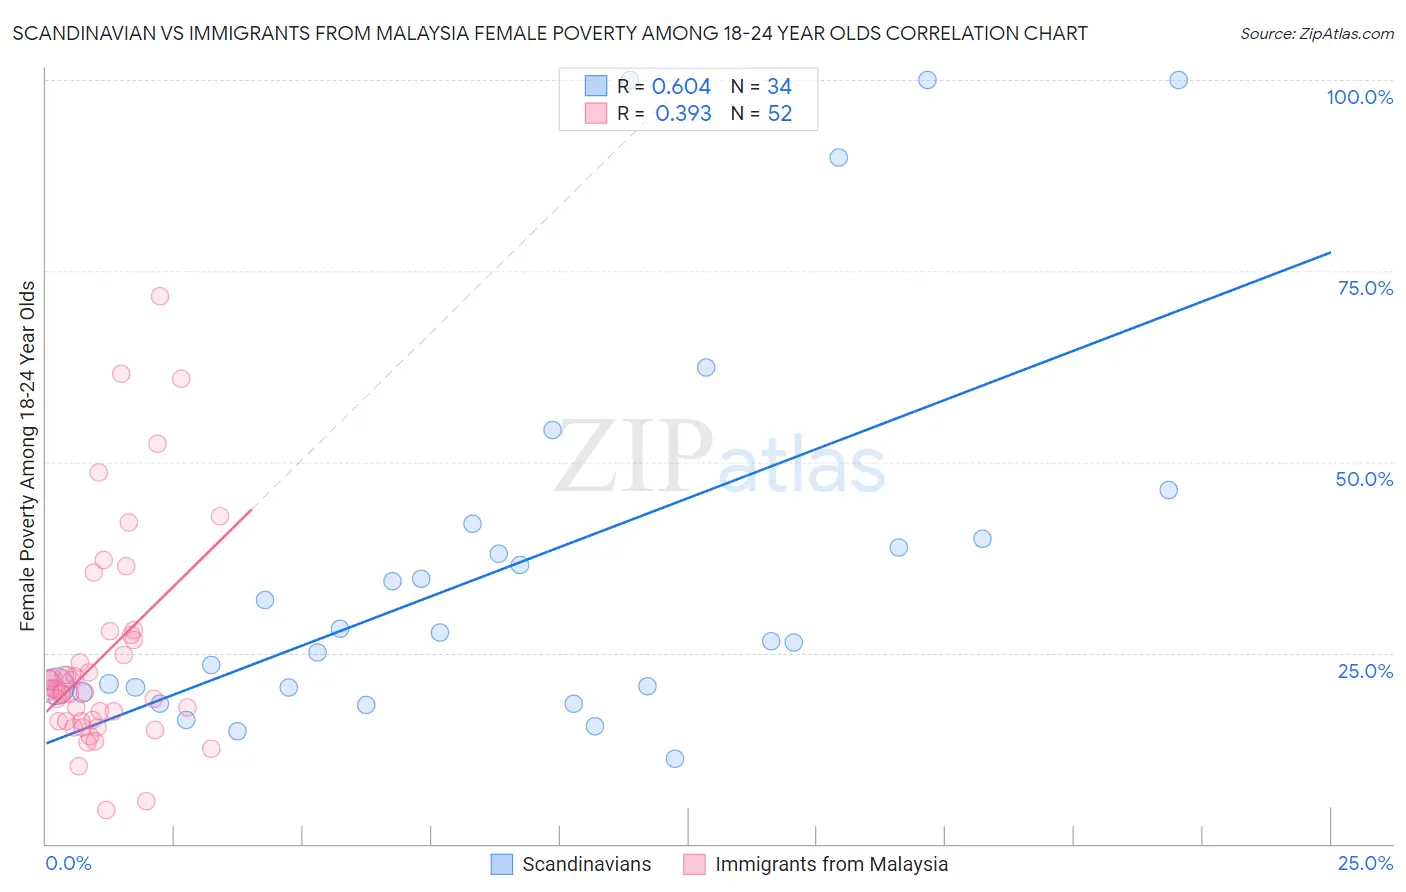
Scandinavian vs Immigrants from Malaysia Female Poverty Among 18-24 Year Olds Correlation Chart
The statistical analysis conducted on geographies consisting of 453,940,776 people shows a significant positive correlation between the proportion of Scandinavians and poverty level among females between the ages 18 and 24 in the United States with a correlation coefficient (R) of 0.604 and weighted average of 20.3%. Similarly, the statistical analysis conducted on geographies consisting of 195,617,735 people shows a mild positive correlation between the proportion of Immigrants from Malaysia and poverty level among females between the ages 18 and 24 in the United States with a correlation coefficient (R) of 0.393 and weighted average of 20.5%, a difference of 1.1%.
Female Poverty Among 18-24 Year Olds Correlation Summary
| Measurement | Scandinavian | Immigrants from Malaysia |
| Minimum | 11.1% | 4.5% |
| Maximum | 100.0% | 71.6% |
| Range | 88.9% | 67.2% |
| Mean | 36.5% | 24.4% |
| Median | 27.1% | 20.1% |
| Interquartile 25% (IQ1) | 20.4% | 16.1% |
| Interquartile 75% (IQ3) | 40.0% | 27.0% |
| Interquartile Range (IQR) | 19.5% | 10.9% |
| Standard Deviation (Sample) | 25.4% | 14.0% |
| Standard Deviation (Population) | 25.0% | 13.8% |
Demographics Similar to Scandinavians and Immigrants from Malaysia by Female Poverty Among 18-24 Year Olds
In terms of female poverty among 18-24 year olds, the demographic groups most similar to Scandinavians are Immigrants from Germany (20.3%, a difference of 0.030%), Immigrants from Mexico (20.2%, a difference of 0.090%), Immigrants from Ethiopia (20.2%, a difference of 0.14%), Nepalese (20.2%, a difference of 0.27%), and Immigrants from Western Asia (20.3%, a difference of 0.30%). Similarly, the demographic groups most similar to Immigrants from Malaysia are Immigrants from Netherlands (20.5%, a difference of 0.020%), Immigrants from Turkey (20.5%, a difference of 0.040%), English (20.5%, a difference of 0.040%), Mexican (20.5%, a difference of 0.090%), and European (20.4%, a difference of 0.22%).
| Demographics | Rating | Rank | Female Poverty Among 18-24 Year Olds |
| Nepalese | 39.7 /100 | #185 | Fair 20.2% |
| Immigrants | Ethiopia | 37.3 /100 | #186 | Fair 20.2% |
| Immigrants | Mexico | 36.3 /100 | #187 | Fair 20.2% |
| Scandinavians | 34.6 /100 | #188 | Fair 20.3% |
| Immigrants | Germany | 34.0 /100 | #189 | Fair 20.3% |
| Immigrants | Western Asia | 29.3 /100 | #190 | Fair 20.3% |
| Moroccans | 25.8 /100 | #191 | Fair 20.4% |
| Immigrants | Israel | 24.4 /100 | #192 | Fair 20.4% |
| Nigerians | 23.4 /100 | #193 | Fair 20.4% |
| Mexican American Indians | 23.2 /100 | #194 | Fair 20.4% |
| Immigrants | Latvia | 23.0 /100 | #195 | Fair 20.4% |
| Czechs | 22.3 /100 | #196 | Fair 20.4% |
| Zimbabweans | 21.0 /100 | #197 | Fair 20.4% |
| Immigrants | Spain | 20.7 /100 | #198 | Fair 20.4% |
| Germans | 20.6 /100 | #199 | Fair 20.4% |
| Europeans | 19.9 /100 | #200 | Poor 20.4% |
| Mexicans | 18.3 /100 | #201 | Poor 20.5% |
| Immigrants | Turkey | 17.7 /100 | #202 | Poor 20.5% |
| Immigrants | Malaysia | 17.2 /100 | #203 | Poor 20.5% |
| Immigrants | Netherlands | 17.0 /100 | #204 | Poor 20.5% |
| English | 16.7 /100 | #205 | Poor 20.5% |