Scandinavian vs Honduran Female Poverty Among 18-24 Year Olds
COMPARE
Scandinavian
Honduran
Female Poverty Among 18-24 Year Olds
Female Poverty Among 18-24 Year Olds Comparison
Scandinavians
Hondurans
20.3%
FEMALE POVERTY AMONG 18-24 YEAR OLDS
34.6/ 100
METRIC RATING
188th/ 347
METRIC RANK
21.5%
FEMALE POVERTY AMONG 18-24 YEAR OLDS
0.3/ 100
METRIC RATING
264th/ 347
METRIC RANK
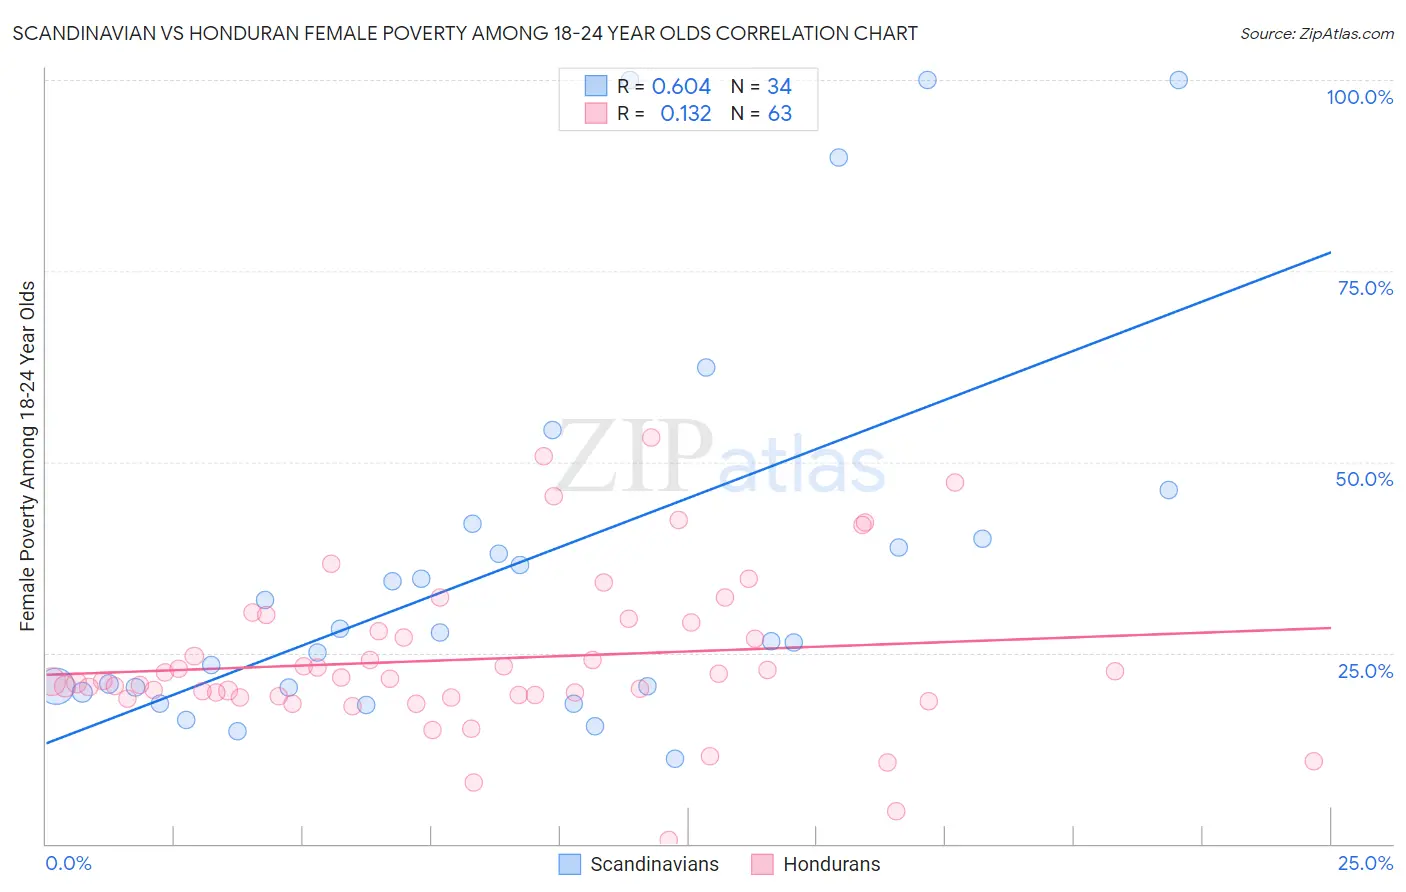
Scandinavian vs Honduran Female Poverty Among 18-24 Year Olds Correlation Chart
The statistical analysis conducted on geographies consisting of 453,940,776 people shows a significant positive correlation between the proportion of Scandinavians and poverty level among females between the ages 18 and 24 in the United States with a correlation coefficient (R) of 0.604 and weighted average of 20.3%. Similarly, the statistical analysis conducted on geographies consisting of 352,497,454 people shows a poor positive correlation between the proportion of Hondurans and poverty level among females between the ages 18 and 24 in the United States with a correlation coefficient (R) of 0.132 and weighted average of 21.5%, a difference of 6.2%.
Female Poverty Among 18-24 Year Olds Correlation Summary
| Measurement | Scandinavian | Honduran |
| Minimum | 11.1% | 0.50% |
| Maximum | 100.0% | 53.1% |
| Range | 88.9% | 52.6% |
| Mean | 36.5% | 24.2% |
| Median | 27.1% | 21.5% |
| Interquartile 25% (IQ1) | 20.4% | 19.3% |
| Interquartile 75% (IQ3) | 40.0% | 28.9% |
| Interquartile Range (IQR) | 19.5% | 9.7% |
| Standard Deviation (Sample) | 25.4% | 10.3% |
| Standard Deviation (Population) | 25.0% | 10.2% |
Similar Demographics by Female Poverty Among 18-24 Year Olds
Demographics Similar to Scandinavians by Female Poverty Among 18-24 Year Olds
In terms of female poverty among 18-24 year olds, the demographic groups most similar to Scandinavians are Immigrants from Germany (20.3%, a difference of 0.030%), Immigrants from Mexico (20.2%, a difference of 0.090%), Immigrants from Ethiopia (20.2%, a difference of 0.14%), Nepalese (20.2%, a difference of 0.27%), and Immigrants from Central America (20.2%, a difference of 0.28%).
| Demographics | Rating | Rank | Female Poverty Among 18-24 Year Olds |
| Immigrants | China | 43.0 /100 | #181 | Average 20.2% |
| Immigrants | Barbados | 42.8 /100 | #182 | Average 20.2% |
| Lebanese | 40.6 /100 | #183 | Average 20.2% |
| Immigrants | Central America | 39.9 /100 | #184 | Fair 20.2% |
| Nepalese | 39.7 /100 | #185 | Fair 20.2% |
| Immigrants | Ethiopia | 37.3 /100 | #186 | Fair 20.2% |
| Immigrants | Mexico | 36.3 /100 | #187 | Fair 20.2% |
| Scandinavians | 34.6 /100 | #188 | Fair 20.3% |
| Immigrants | Germany | 34.0 /100 | #189 | Fair 20.3% |
| Immigrants | Western Asia | 29.3 /100 | #190 | Fair 20.3% |
| Moroccans | 25.8 /100 | #191 | Fair 20.4% |
| Immigrants | Israel | 24.4 /100 | #192 | Fair 20.4% |
| Nigerians | 23.4 /100 | #193 | Fair 20.4% |
| Mexican American Indians | 23.2 /100 | #194 | Fair 20.4% |
| Immigrants | Latvia | 23.0 /100 | #195 | Fair 20.4% |
Demographics Similar to Hondurans by Female Poverty Among 18-24 Year Olds
In terms of female poverty among 18-24 year olds, the demographic groups most similar to Hondurans are Nonimmigrants (21.5%, a difference of 0.010%), Icelander (21.5%, a difference of 0.050%), Alaska Native (21.5%, a difference of 0.070%), American (21.6%, a difference of 0.16%), and Immigrants from Burma/Myanmar (21.6%, a difference of 0.31%).
| Demographics | Rating | Rank | Female Poverty Among 18-24 Year Olds |
| Taiwanese | 1.0 /100 | #257 | Tragic 21.2% |
| Vietnamese | 0.6 /100 | #258 | Tragic 21.4% |
| Immigrants | France | 0.6 /100 | #259 | Tragic 21.4% |
| Immigrants | Norway | 0.6 /100 | #260 | Tragic 21.4% |
| Immigrants | Bahamas | 0.5 /100 | #261 | Tragic 21.4% |
| Immigrants | Eastern Africa | 0.4 /100 | #262 | Tragic 21.4% |
| Icelanders | 0.3 /100 | #263 | Tragic 21.5% |
| Hondurans | 0.3 /100 | #264 | Tragic 21.5% |
| Immigrants | Nonimmigrants | 0.3 /100 | #265 | Tragic 21.5% |
| Alaska Natives | 0.3 /100 | #266 | Tragic 21.5% |
| Americans | 0.3 /100 | #267 | Tragic 21.6% |
| Immigrants | Burma/Myanmar | 0.2 /100 | #268 | Tragic 21.6% |
| Celtics | 0.2 /100 | #269 | Tragic 21.6% |
| Mongolians | 0.2 /100 | #270 | Tragic 21.6% |
| Scotch-Irish | 0.2 /100 | #271 | Tragic 21.6% |