Samoan vs Kiowa Female Poverty Among 25-34 Year Olds
COMPARE
Samoan
Kiowa
Female Poverty Among 25-34 Year Olds
Female Poverty Among 25-34 Year Olds Comparison
Samoans
Kiowa
13.5%
FEMALE POVERTY AMONG 25-34 YEAR OLDS
56.8/ 100
METRIC RATING
169th/ 347
METRIC RANK
19.7%
FEMALE POVERTY AMONG 25-34 YEAR OLDS
0.0/ 100
METRIC RATING
331st/ 347
METRIC RANK
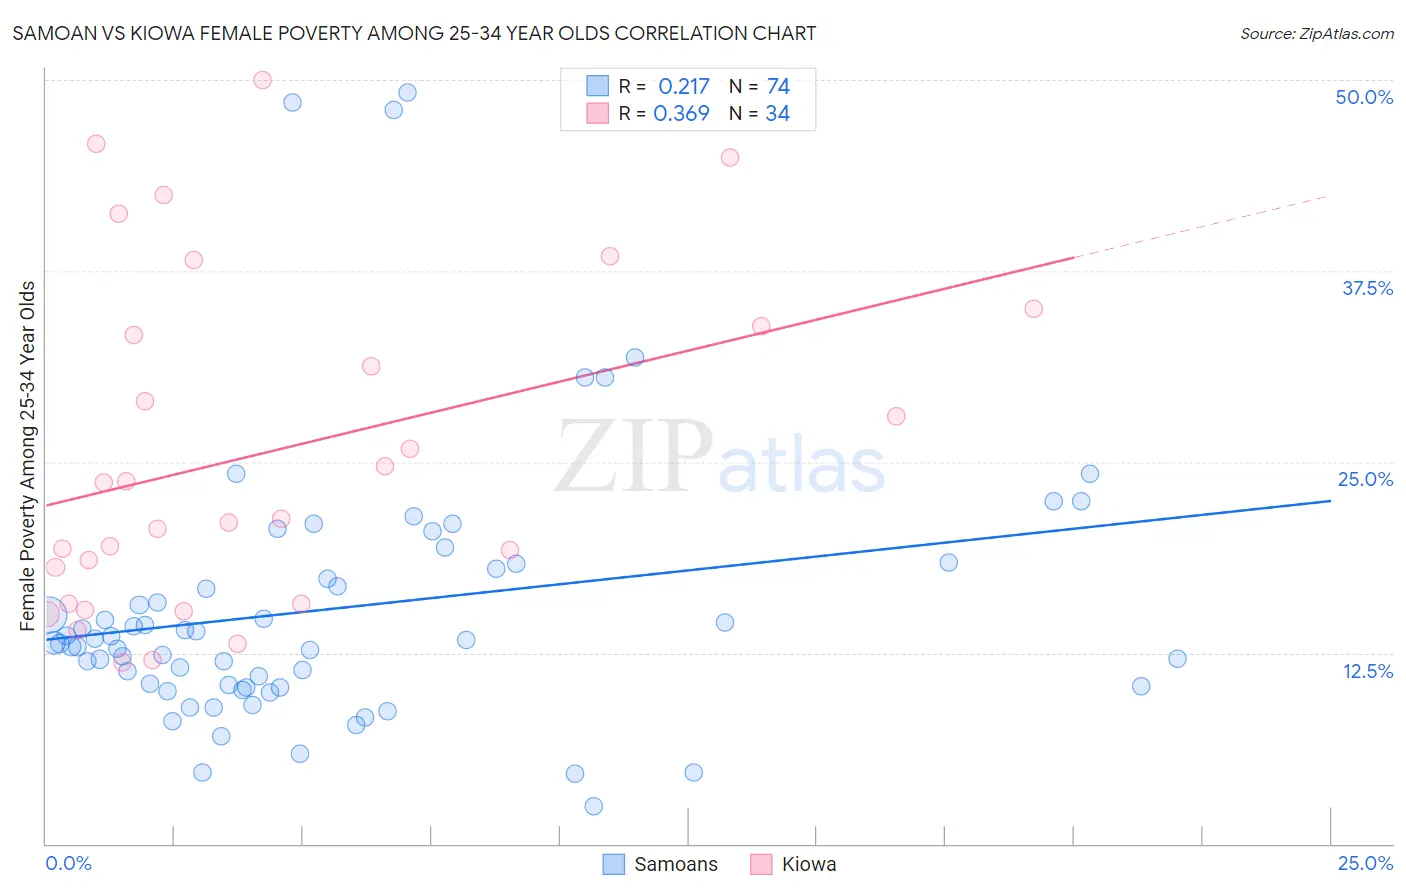
Samoan vs Kiowa Female Poverty Among 25-34 Year Olds Correlation Chart
The statistical analysis conducted on geographies consisting of 223,994,438 people shows a weak positive correlation between the proportion of Samoans and poverty level among females between the ages 25 and 34 in the United States with a correlation coefficient (R) of 0.217 and weighted average of 13.5%. Similarly, the statistical analysis conducted on geographies consisting of 56,020,339 people shows a mild positive correlation between the proportion of Kiowa and poverty level among females between the ages 25 and 34 in the United States with a correlation coefficient (R) of 0.369 and weighted average of 19.7%, a difference of 46.2%.
Female Poverty Among 25-34 Year Olds Correlation Summary
| Measurement | Samoan | Kiowa |
| Minimum | 2.5% | 11.9% |
| Maximum | 49.2% | 50.0% |
| Range | 46.7% | 38.1% |
| Mean | 15.4% | 25.7% |
| Median | 13.3% | 22.5% |
| Interquartile 25% (IQ1) | 10.3% | 15.7% |
| Interquartile 75% (IQ3) | 18.0% | 33.8% |
| Interquartile Range (IQR) | 7.7% | 18.1% |
| Standard Deviation (Sample) | 9.0% | 11.0% |
| Standard Deviation (Population) | 8.9% | 10.8% |
Similar Demographics by Female Poverty Among 25-34 Year Olds
Demographics Similar to Samoans by Female Poverty Among 25-34 Year Olds
In terms of female poverty among 25-34 year olds, the demographic groups most similar to Samoans are Immigrants from Afghanistan (13.4%, a difference of 0.080%), Immigrants from Bosnia and Herzegovina (13.4%, a difference of 0.16%), Belgian (13.4%, a difference of 0.18%), Basque (13.4%, a difference of 0.21%), and Immigrants from Uganda (13.5%, a difference of 0.32%).
| Demographics | Rating | Rank | Female Poverty Among 25-34 Year Olds |
| Ugandans | 64.1 /100 | #162 | Good 13.4% |
| British | 63.5 /100 | #163 | Good 13.4% |
| Swiss | 61.7 /100 | #164 | Good 13.4% |
| Basques | 59.3 /100 | #165 | Average 13.4% |
| Belgians | 58.9 /100 | #166 | Average 13.4% |
| Immigrants | Bosnia and Herzegovina | 58.6 /100 | #167 | Average 13.4% |
| Immigrants | Afghanistan | 57.7 /100 | #168 | Average 13.4% |
| Samoans | 56.8 /100 | #169 | Average 13.5% |
| Immigrants | Uganda | 53.0 /100 | #170 | Average 13.5% |
| South American Indians | 51.9 /100 | #171 | Average 13.5% |
| Immigrants | Costa Rica | 51.9 /100 | #172 | Average 13.5% |
| Kenyans | 51.8 /100 | #173 | Average 13.5% |
| Immigrants | Oceania | 50.0 /100 | #174 | Average 13.5% |
| Bermudans | 46.8 /100 | #175 | Average 13.6% |
| Yugoslavians | 45.0 /100 | #176 | Average 13.6% |
Demographics Similar to Kiowa by Female Poverty Among 25-34 Year Olds
In terms of female poverty among 25-34 year olds, the demographic groups most similar to Kiowa are Paiute (19.6%, a difference of 0.42%), Immigrants from Yemen (19.8%, a difference of 0.59%), Cajun (19.9%, a difference of 1.4%), Apache (20.1%, a difference of 2.1%), and Creek (19.2%, a difference of 2.7%).
| Demographics | Rating | Rank | Female Poverty Among 25-34 Year Olds |
| Dutch West Indians | 0.0 /100 | #324 | Tragic 18.4% |
| Inupiat | 0.0 /100 | #325 | Tragic 18.5% |
| Blacks/African Americans | 0.0 /100 | #326 | Tragic 18.9% |
| Cheyenne | 0.0 /100 | #327 | Tragic 19.1% |
| Alaskan Athabascans | 0.0 /100 | #328 | Tragic 19.1% |
| Creek | 0.0 /100 | #329 | Tragic 19.2% |
| Paiute | 0.0 /100 | #330 | Tragic 19.6% |
| Kiowa | 0.0 /100 | #331 | Tragic 19.7% |
| Immigrants | Yemen | 0.0 /100 | #332 | Tragic 19.8% |
| Cajuns | 0.0 /100 | #333 | Tragic 19.9% |
| Apache | 0.0 /100 | #334 | Tragic 20.1% |
| Natives/Alaskans | 0.0 /100 | #335 | Tragic 20.3% |
| Pueblo | 0.0 /100 | #336 | Tragic 22.2% |
| Crow | 0.0 /100 | #337 | Tragic 22.7% |
| Houma | 0.0 /100 | #338 | Tragic 22.7% |