Puget Sound Salish vs Ukrainian Poverty
COMPARE
Puget Sound Salish
Ukrainian
Poverty
Poverty Comparison
Puget Sound Salish
Ukrainians
11.7%
POVERTY
88.7/ 100
METRIC RATING
122nd/ 347
METRIC RANK
11.2%
POVERTY
97.8/ 100
METRIC RATING
63rd/ 347
METRIC RANK
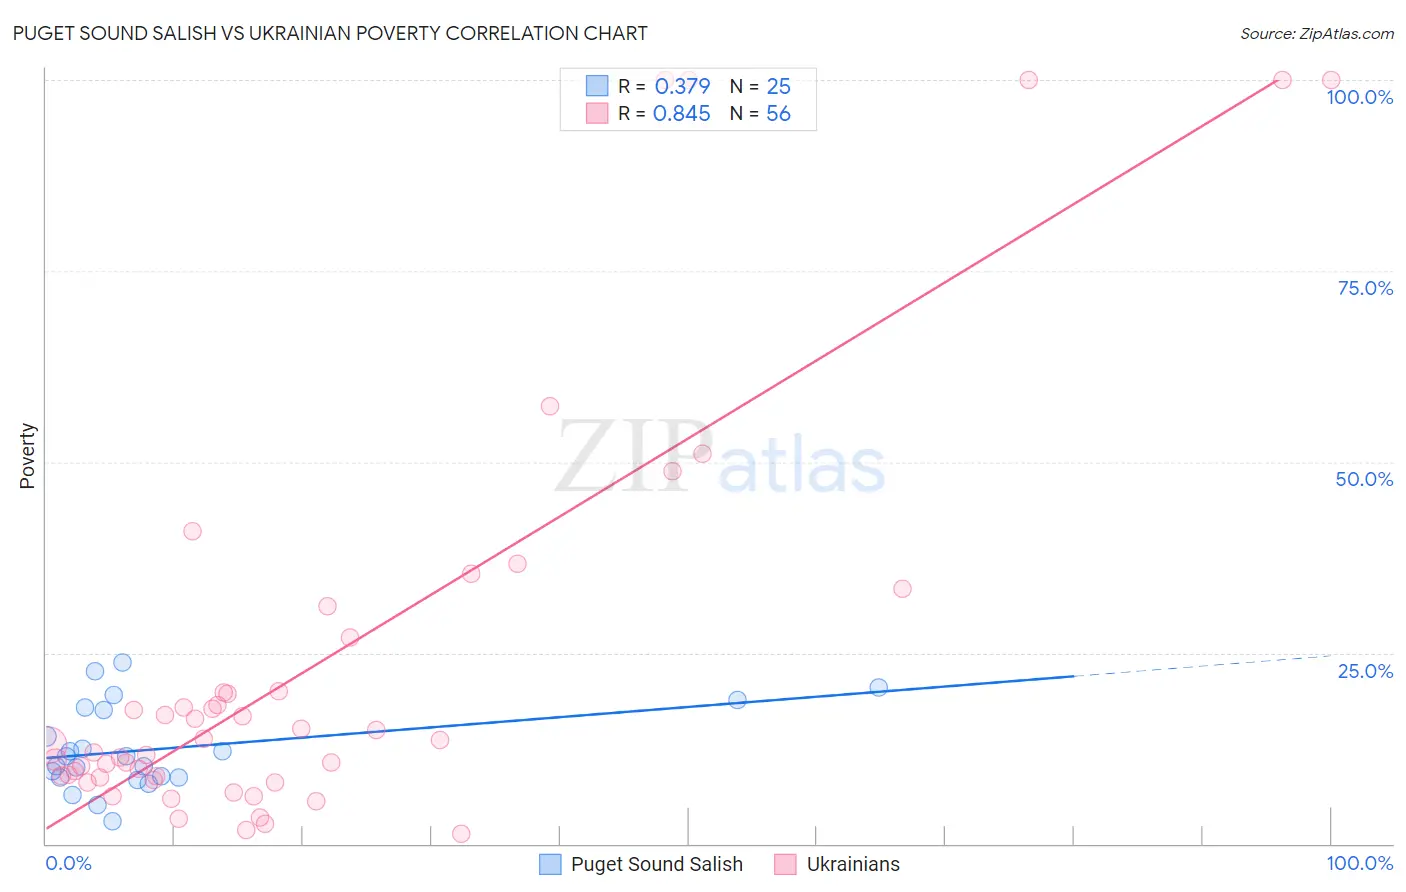
Puget Sound Salish vs Ukrainian Poverty Correlation Chart
The statistical analysis conducted on geographies consisting of 46,150,573 people shows a mild positive correlation between the proportion of Puget Sound Salish and poverty level in the United States with a correlation coefficient (R) of 0.379 and weighted average of 11.7%. Similarly, the statistical analysis conducted on geographies consisting of 448,287,905 people shows a very strong positive correlation between the proportion of Ukrainians and poverty level in the United States with a correlation coefficient (R) of 0.845 and weighted average of 11.2%, a difference of 4.7%.
Poverty Correlation Summary
| Measurement | Puget Sound Salish | Ukrainian |
| Minimum | 3.0% | 1.3% |
| Maximum | 23.7% | 100.0% |
| Range | 20.7% | 98.7% |
| Mean | 12.4% | 23.6% |
| Median | 11.4% | 13.2% |
| Interquartile 25% (IQ1) | 8.7% | 8.7% |
| Interquartile 75% (IQ3) | 17.7% | 23.5% |
| Interquartile Range (IQR) | 9.0% | 14.7% |
| Standard Deviation (Sample) | 5.5% | 27.1% |
| Standard Deviation (Population) | 5.4% | 26.8% |
Similar Demographics by Poverty
Demographics Similar to Puget Sound Salish by Poverty
In terms of poverty, the demographic groups most similar to Puget Sound Salish are New Zealander (11.7%, a difference of 0.0%), Immigrants from Hungary (11.7%, a difference of 0.020%), Immigrants from South Eastern Asia (11.7%, a difference of 0.060%), Tlingit-Haida (11.7%, a difference of 0.070%), and Soviet Union (11.7%, a difference of 0.090%).
| Demographics | Rating | Rank | Poverty |
| Albanians | 90.3 /100 | #115 | Exceptional 11.7% |
| Immigrants | Russia | 89.7 /100 | #116 | Excellent 11.7% |
| Sri Lankans | 89.4 /100 | #117 | Excellent 11.7% |
| Argentineans | 89.1 /100 | #118 | Excellent 11.7% |
| Tlingit-Haida | 89.0 /100 | #119 | Excellent 11.7% |
| Immigrants | South Eastern Asia | 88.9 /100 | #120 | Excellent 11.7% |
| New Zealanders | 88.7 /100 | #121 | Excellent 11.7% |
| Puget Sound Salish | 88.7 /100 | #122 | Excellent 11.7% |
| Immigrants | Hungary | 88.6 /100 | #123 | Excellent 11.7% |
| Soviet Union | 88.4 /100 | #124 | Excellent 11.7% |
| Immigrants | Brazil | 88.2 /100 | #125 | Excellent 11.7% |
| Immigrants | Norway | 88.0 /100 | #126 | Excellent 11.7% |
| Immigrants | Argentina | 88.0 /100 | #127 | Excellent 11.7% |
| Immigrants | Israel | 87.4 /100 | #128 | Excellent 11.7% |
| South Africans | 87.0 /100 | #129 | Excellent 11.7% |
Demographics Similar to Ukrainians by Poverty
In terms of poverty, the demographic groups most similar to Ukrainians are Austrian (11.2%, a difference of 0.0%), Immigrants from Italy (11.2%, a difference of 0.040%), Immigrants from Sri Lanka (11.2%, a difference of 0.10%), Swiss (11.2%, a difference of 0.22%), and Immigrants from Europe (11.2%, a difference of 0.26%).
| Demographics | Rating | Rank | Poverty |
| Estonians | 98.2 /100 | #56 | Exceptional 11.1% |
| Scandinavians | 98.2 /100 | #57 | Exceptional 11.1% |
| Germans | 98.1 /100 | #58 | Exceptional 11.1% |
| Immigrants | Europe | 98.0 /100 | #59 | Exceptional 11.2% |
| Immigrants | Sri Lanka | 97.9 /100 | #60 | Exceptional 11.2% |
| Immigrants | Italy | 97.9 /100 | #61 | Exceptional 11.2% |
| Austrians | 97.8 /100 | #62 | Exceptional 11.2% |
| Ukrainians | 97.8 /100 | #63 | Exceptional 11.2% |
| Swiss | 97.7 /100 | #64 | Exceptional 11.2% |
| Immigrants | Asia | 97.5 /100 | #65 | Exceptional 11.2% |
| Immigrants | Netherlands | 97.5 /100 | #66 | Exceptional 11.2% |
| Immigrants | Australia | 97.4 /100 | #67 | Exceptional 11.2% |
| Slovaks | 97.4 /100 | #68 | Exceptional 11.2% |
| Serbians | 97.4 /100 | #69 | Exceptional 11.2% |
| Immigrants | Canada | 97.3 /100 | #70 | Exceptional 11.3% |