Immigrants from Morocco vs Immigrants from Armenia Female Poverty Among 25-34 Year Olds
COMPARE
Immigrants from Morocco
Immigrants from Armenia
Female Poverty Among 25-34 Year Olds
Female Poverty Among 25-34 Year Olds Comparison
Immigrants from Morocco
Immigrants from Armenia
12.8%
FEMALE POVERTY AMONG 25-34 YEAR OLDS
93.9/ 100
METRIC RATING
112th/ 347
METRIC RANK
12.6%
FEMALE POVERTY AMONG 25-34 YEAR OLDS
96.9/ 100
METRIC RATING
92nd/ 347
METRIC RANK
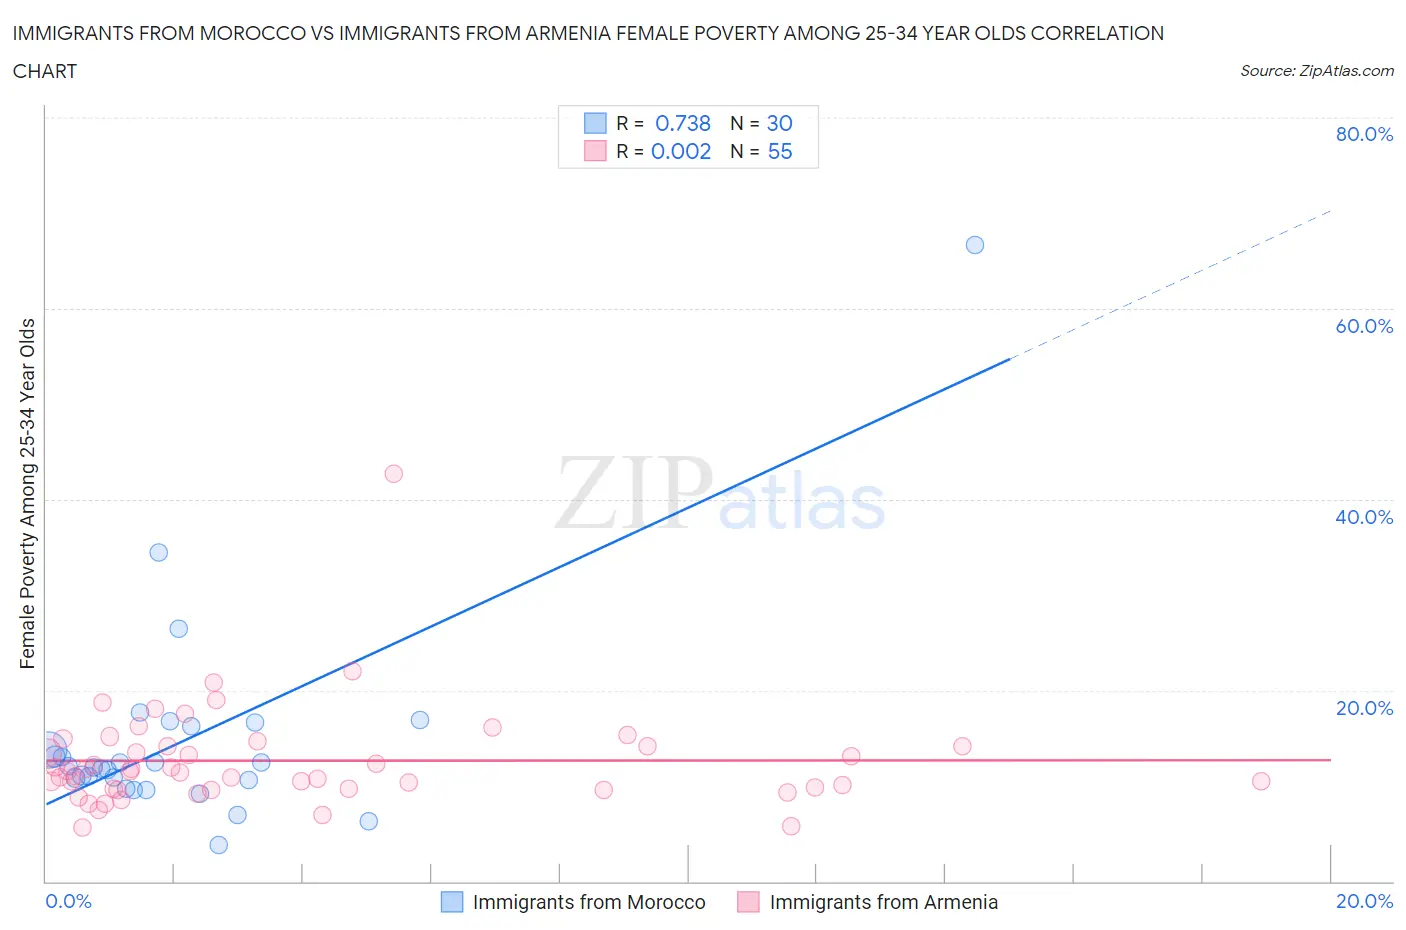
Immigrants from Morocco vs Immigrants from Armenia Female Poverty Among 25-34 Year Olds Correlation Chart
The statistical analysis conducted on geographies consisting of 177,827,944 people shows a strong positive correlation between the proportion of Immigrants from Morocco and poverty level among females between the ages 25 and 34 in the United States with a correlation coefficient (R) of 0.738 and weighted average of 12.8%. Similarly, the statistical analysis conducted on geographies consisting of 97,252,675 people shows no correlation between the proportion of Immigrants from Armenia and poverty level among females between the ages 25 and 34 in the United States with a correlation coefficient (R) of 0.002 and weighted average of 12.6%, a difference of 1.6%.
Female Poverty Among 25-34 Year Olds Correlation Summary
| Measurement | Immigrants from Morocco | Immigrants from Armenia |
| Minimum | 3.8% | 5.6% |
| Maximum | 66.7% | 42.7% |
| Range | 62.9% | 37.1% |
| Mean | 14.9% | 12.6% |
| Median | 12.0% | 11.5% |
| Interquartile 25% (IQ1) | 10.6% | 9.7% |
| Interquartile 75% (IQ3) | 16.2% | 14.2% |
| Interquartile Range (IQR) | 5.6% | 4.5% |
| Standard Deviation (Sample) | 11.4% | 5.4% |
| Standard Deviation (Population) | 11.2% | 5.4% |
Demographics Similar to Immigrants from Morocco and Immigrants from Armenia by Female Poverty Among 25-34 Year Olds
In terms of female poverty among 25-34 year olds, the demographic groups most similar to Immigrants from Morocco are Danish (12.8%, a difference of 0.020%), Australian (12.8%, a difference of 0.090%), Immigrants from Peru (12.7%, a difference of 0.17%), Immigrants from Norway (12.7%, a difference of 0.19%), and Polish (12.7%, a difference of 0.44%). Similarly, the demographic groups most similar to Immigrants from Armenia are Palestinian (12.6%, a difference of 0.030%), Immigrants from France (12.6%, a difference of 0.090%), Ukrainian (12.6%, a difference of 0.12%), Immigrants from Zimbabwe (12.6%, a difference of 0.13%), and Immigrants from Northern Africa (12.6%, a difference of 0.25%).
| Demographics | Rating | Rank | Female Poverty Among 25-34 Year Olds |
| Immigrants | Armenia | 96.9 /100 | #92 | Exceptional 12.6% |
| Palestinians | 96.9 /100 | #93 | Exceptional 12.6% |
| Immigrants | France | 96.8 /100 | #94 | Exceptional 12.6% |
| Ukrainians | 96.7 /100 | #95 | Exceptional 12.6% |
| Immigrants | Zimbabwe | 96.7 /100 | #96 | Exceptional 12.6% |
| Immigrants | Northern Africa | 96.6 /100 | #97 | Exceptional 12.6% |
| Immigrants | Ethiopia | 96.5 /100 | #98 | Exceptional 12.6% |
| Immigrants | Argentina | 96.4 /100 | #99 | Exceptional 12.6% |
| Immigrants | Denmark | 95.7 /100 | #100 | Exceptional 12.7% |
| Immigrants | Switzerland | 95.7 /100 | #101 | Exceptional 12.7% |
| Peruvians | 95.6 /100 | #102 | Exceptional 12.7% |
| Immigrants | Spain | 95.5 /100 | #103 | Exceptional 12.7% |
| Swedes | 95.4 /100 | #104 | Exceptional 12.7% |
| Immigrants | South Africa | 95.3 /100 | #105 | Exceptional 12.7% |
| Tsimshian | 95.1 /100 | #106 | Exceptional 12.7% |
| Poles | 94.9 /100 | #107 | Exceptional 12.7% |
| Immigrants | Norway | 94.4 /100 | #108 | Exceptional 12.7% |
| Immigrants | Peru | 94.3 /100 | #109 | Exceptional 12.7% |
| Australians | 94.1 /100 | #110 | Exceptional 12.8% |
| Danes | 93.9 /100 | #111 | Exceptional 12.8% |
| Immigrants | Morocco | 93.9 /100 | #112 | Exceptional 12.8% |