Potawatomi vs Israeli Seniors Poverty Over the Age of 65
COMPARE
Potawatomi
Israeli
Seniors Poverty Over the Age of 65
Seniors Poverty Over the Age of 65 Comparison
Potawatomi
Israelis
10.8%
SENIORS POVERTY OVER THE AGE OF 65
62.6/ 100
METRIC RATING
164th/ 347
METRIC RANK
11.3%
SENIORS POVERTY OVER THE AGE OF 65
16.5/ 100
METRIC RATING
204th/ 347
METRIC RANK
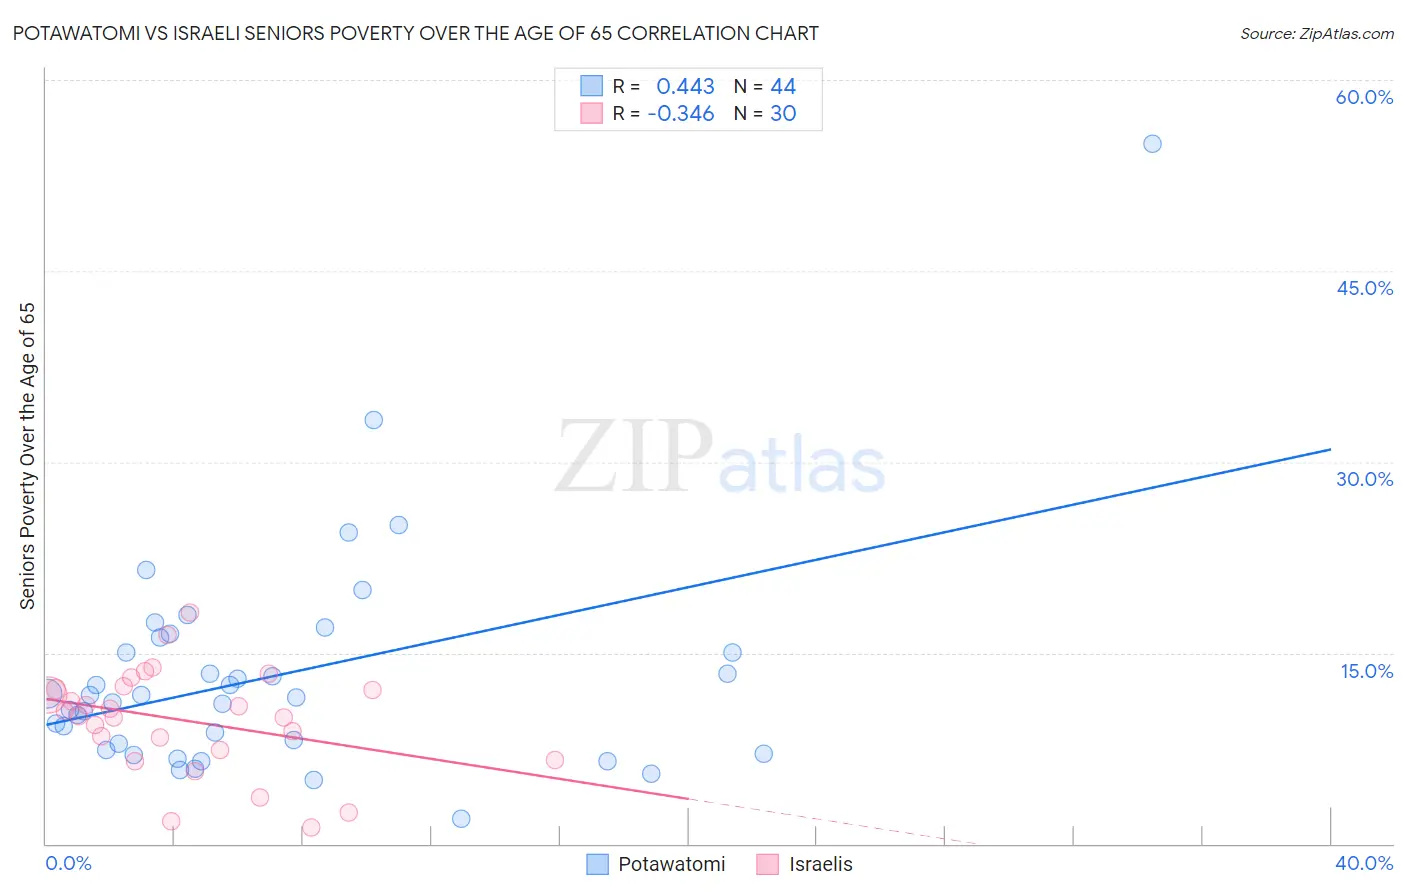
Potawatomi vs Israeli Seniors Poverty Over the Age of 65 Correlation Chart
The statistical analysis conducted on geographies consisting of 117,657,518 people shows a moderate positive correlation between the proportion of Potawatomi and poverty level among seniors over the age of 65 in the United States with a correlation coefficient (R) of 0.443 and weighted average of 10.8%. Similarly, the statistical analysis conducted on geographies consisting of 210,589,570 people shows a mild negative correlation between the proportion of Israelis and poverty level among seniors over the age of 65 in the United States with a correlation coefficient (R) of -0.346 and weighted average of 11.3%, a difference of 4.8%.
Seniors Poverty Over the Age of 65 Correlation Summary
| Measurement | Potawatomi | Israeli |
| Minimum | 1.9% | 1.3% |
| Maximum | 55.0% | 18.2% |
| Range | 53.1% | 16.9% |
| Mean | 13.2% | 9.7% |
| Median | 11.6% | 10.2% |
| Interquartile 25% (IQ1) | 7.6% | 7.3% |
| Interquartile 75% (IQ3) | 15.6% | 12.2% |
| Interquartile Range (IQR) | 8.0% | 4.9% |
| Standard Deviation (Sample) | 8.8% | 4.0% |
| Standard Deviation (Population) | 8.7% | 4.0% |
Similar Demographics by Seniors Poverty Over the Age of 65
Demographics Similar to Potawatomi by Seniors Poverty Over the Age of 65
In terms of seniors poverty over the age of 65, the demographic groups most similar to Potawatomi are Immigrants from South Eastern Asia (10.8%, a difference of 0.050%), Malaysian (10.8%, a difference of 0.060%), Tsimshian (10.8%, a difference of 0.19%), Immigrants from Indonesia (10.8%, a difference of 0.22%), and Alaska Native (10.8%, a difference of 0.22%).
| Demographics | Rating | Rank | Seniors Poverty Over the Age of 65 |
| Immigrants | Ethiopia | 72.9 /100 | #157 | Good 10.7% |
| Immigrants | Sierra Leone | 71.7 /100 | #158 | Good 10.7% |
| Immigrants | Micronesia | 70.8 /100 | #159 | Good 10.7% |
| Sudanese | 68.2 /100 | #160 | Good 10.7% |
| Arabs | 65.2 /100 | #161 | Good 10.8% |
| Immigrants | Indonesia | 64.8 /100 | #162 | Good 10.8% |
| Tsimshian | 64.5 /100 | #163 | Good 10.8% |
| Potawatomi | 62.6 /100 | #164 | Good 10.8% |
| Immigrants | South Eastern Asia | 62.1 /100 | #165 | Good 10.8% |
| Malaysians | 62.0 /100 | #166 | Good 10.8% |
| Alaska Natives | 60.3 /100 | #167 | Good 10.8% |
| Mongolians | 58.0 /100 | #168 | Average 10.9% |
| Sri Lankans | 56.8 /100 | #169 | Average 10.9% |
| Immigrants | Eastern Europe | 55.8 /100 | #170 | Average 10.9% |
| Immigrants | Nonimmigrants | 55.1 /100 | #171 | Average 10.9% |
Demographics Similar to Israelis by Seniors Poverty Over the Age of 65
In terms of seniors poverty over the age of 65, the demographic groups most similar to Israelis are Immigrants from Zaire (11.3%, a difference of 0.070%), Costa Rican (11.3%, a difference of 0.080%), Brazilian (11.3%, a difference of 0.18%), Immigrants from Brazil (11.3%, a difference of 0.19%), and Choctaw (11.4%, a difference of 0.32%).
| Demographics | Rating | Rank | Seniors Poverty Over the Age of 65 |
| Albanians | 24.4 /100 | #197 | Fair 11.2% |
| Immigrants | Burma/Myanmar | 21.3 /100 | #198 | Fair 11.3% |
| Immigrants | Israel | 20.3 /100 | #199 | Fair 11.3% |
| Alsatians | 20.1 /100 | #200 | Fair 11.3% |
| Immigrants | Brazil | 17.8 /100 | #201 | Poor 11.3% |
| Costa Ricans | 17.0 /100 | #202 | Poor 11.3% |
| Immigrants | Zaire | 16.9 /100 | #203 | Poor 11.3% |
| Israelis | 16.5 /100 | #204 | Poor 11.3% |
| Brazilians | 15.4 /100 | #205 | Poor 11.3% |
| Choctaw | 14.5 /100 | #206 | Poor 11.4% |
| Immigrants | Western Asia | 13.6 /100 | #207 | Poor 11.4% |
| South American Indians | 11.7 /100 | #208 | Poor 11.4% |
| Paraguayans | 11.3 /100 | #209 | Poor 11.4% |
| Ugandans | 11.2 /100 | #210 | Poor 11.4% |
| Indonesians | 10.4 /100 | #211 | Poor 11.5% |