Potawatomi vs Israeli Unemployment Among Ages 30 to 34 years
COMPARE
Potawatomi
Israeli
Unemployment Among Ages 30 to 34 years
Unemployment Among Ages 30 to 34 years Comparison
Potawatomi
Israelis
6.0%
UNEMPLOYMENT AMONG AGES 30 TO 34 YEARS
0.2/ 100
METRIC RATING
252nd/ 347
METRIC RANK
5.6%
UNEMPLOYMENT AMONG AGES 30 TO 34 YEARS
12.8/ 100
METRIC RATING
207th/ 347
METRIC RANK
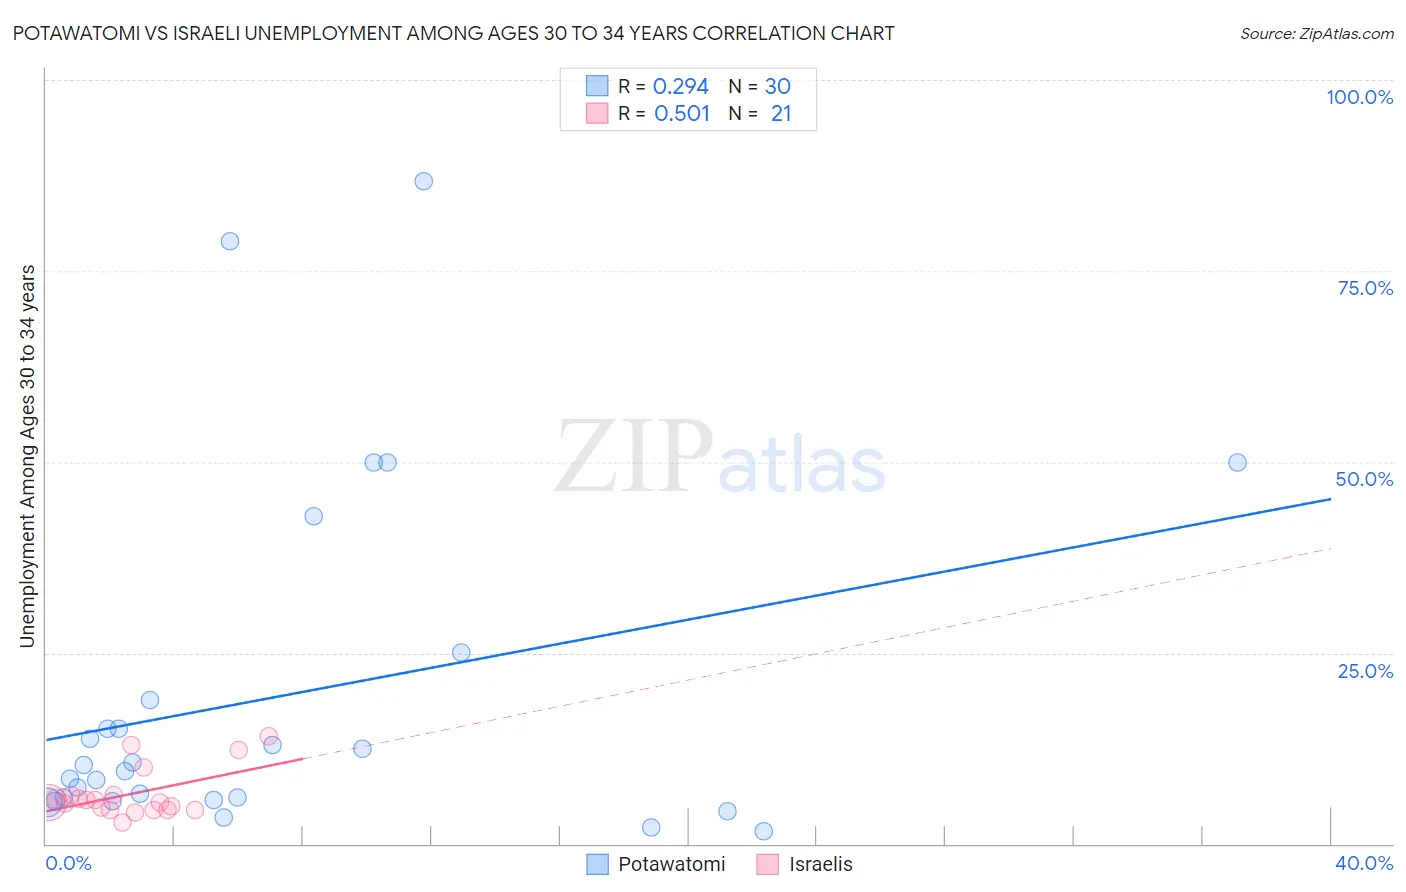
Potawatomi vs Israeli Unemployment Among Ages 30 to 34 years Correlation Chart
The statistical analysis conducted on geographies consisting of 114,286,422 people shows a weak positive correlation between the proportion of Potawatomi and unemployment rate among population between the ages 30 and 34 in the United States with a correlation coefficient (R) of 0.294 and weighted average of 6.0%. Similarly, the statistical analysis conducted on geographies consisting of 204,527,742 people shows a substantial positive correlation between the proportion of Israelis and unemployment rate among population between the ages 30 and 34 in the United States with a correlation coefficient (R) of 0.501 and weighted average of 5.6%, a difference of 6.9%.
Unemployment Among Ages 30 to 34 years Correlation Summary
| Measurement | Potawatomi | Israeli |
| Minimum | 1.6% | 2.8% |
| Maximum | 86.7% | 14.1% |
| Range | 85.1% | 11.3% |
| Mean | 19.3% | 6.5% |
| Median | 9.9% | 5.4% |
| Interquartile 25% (IQ1) | 5.7% | 4.5% |
| Interquartile 75% (IQ3) | 18.8% | 6.4% |
| Interquartile Range (IQR) | 13.1% | 1.9% |
| Standard Deviation (Sample) | 22.5% | 3.1% |
| Standard Deviation (Population) | 22.1% | 3.0% |
Similar Demographics by Unemployment Among Ages 30 to 34 years
Demographics Similar to Potawatomi by Unemployment Among Ages 30 to 34 years
In terms of unemployment among ages 30 to 34 years, the demographic groups most similar to Potawatomi are Tlingit-Haida (6.0%, a difference of 0.020%), Immigrants from Honduras (6.0%, a difference of 0.21%), Honduran (6.0%, a difference of 0.30%), Nigerian (6.0%, a difference of 0.31%), and Immigrants from Guatemala (6.0%, a difference of 0.31%).
| Demographics | Rating | Rank | Unemployment Among Ages 30 to 34 years |
| Sub-Saharan Africans | 0.3 /100 | #245 | Tragic 6.0% |
| Ghanaians | 0.3 /100 | #246 | Tragic 6.0% |
| Nigerians | 0.3 /100 | #247 | Tragic 6.0% |
| Immigrants | Guatemala | 0.3 /100 | #248 | Tragic 6.0% |
| Hondurans | 0.3 /100 | #249 | Tragic 6.0% |
| Immigrants | Honduras | 0.3 /100 | #250 | Tragic 6.0% |
| Tlingit-Haida | 0.2 /100 | #251 | Tragic 6.0% |
| Potawatomi | 0.2 /100 | #252 | Tragic 6.0% |
| Immigrants | Nonimmigrants | 0.2 /100 | #253 | Tragic 6.1% |
| Armenians | 0.1 /100 | #254 | Tragic 6.1% |
| Immigrants | Portugal | 0.1 /100 | #255 | Tragic 6.1% |
| Immigrants | Ghana | 0.1 /100 | #256 | Tragic 6.1% |
| Immigrants | Sierra Leone | 0.1 /100 | #257 | Tragic 6.1% |
| Mexicans | 0.1 /100 | #258 | Tragic 6.1% |
| Haitians | 0.1 /100 | #259 | Tragic 6.1% |
Demographics Similar to Israelis by Unemployment Among Ages 30 to 34 years
In terms of unemployment among ages 30 to 34 years, the demographic groups most similar to Israelis are Immigrants from Philippines (5.7%, a difference of 0.21%), Alsatian (5.6%, a difference of 0.22%), Immigrants from Costa Rica (5.6%, a difference of 0.23%), French (5.7%, a difference of 0.33%), and White/Caucasian (5.7%, a difference of 0.64%).
| Demographics | Rating | Rank | Unemployment Among Ages 30 to 34 years |
| Immigrants | Southern Europe | 25.8 /100 | #200 | Fair 5.6% |
| South American Indians | 24.4 /100 | #201 | Fair 5.6% |
| Immigrants | Germany | 22.9 /100 | #202 | Fair 5.6% |
| Koreans | 20.7 /100 | #203 | Fair 5.6% |
| Immigrants | Cameroon | 18.4 /100 | #204 | Poor 5.6% |
| Immigrants | Costa Rica | 14.4 /100 | #205 | Poor 5.6% |
| Alsatians | 14.3 /100 | #206 | Poor 5.6% |
| Israelis | 12.8 /100 | #207 | Poor 5.6% |
| Immigrants | Philippines | 11.5 /100 | #208 | Poor 5.7% |
| French | 10.8 /100 | #209 | Poor 5.7% |
| Whites/Caucasians | 9.2 /100 | #210 | Tragic 5.7% |
| Spanish American Indians | 8.7 /100 | #211 | Tragic 5.7% |
| Scotch-Irish | 8.6 /100 | #212 | Tragic 5.7% |
| Immigrants | Immigrants | 7.1 /100 | #213 | Tragic 5.7% |
| Immigrants | Panama | 5.9 /100 | #214 | Tragic 5.7% |