Polish vs Immigrants from Bolivia Single Female Poverty
COMPARE
Polish
Immigrants from Bolivia
Single Female Poverty
Single Female Poverty Comparison
Poles
Immigrants from Bolivia
20.0%
SINGLE FEMALE POVERTY
95.6/ 100
METRIC RATING
117th/ 347
METRIC RANK
17.8%
SINGLE FEMALE POVERTY
100.0/ 100
METRIC RATING
13th/ 347
METRIC RANK
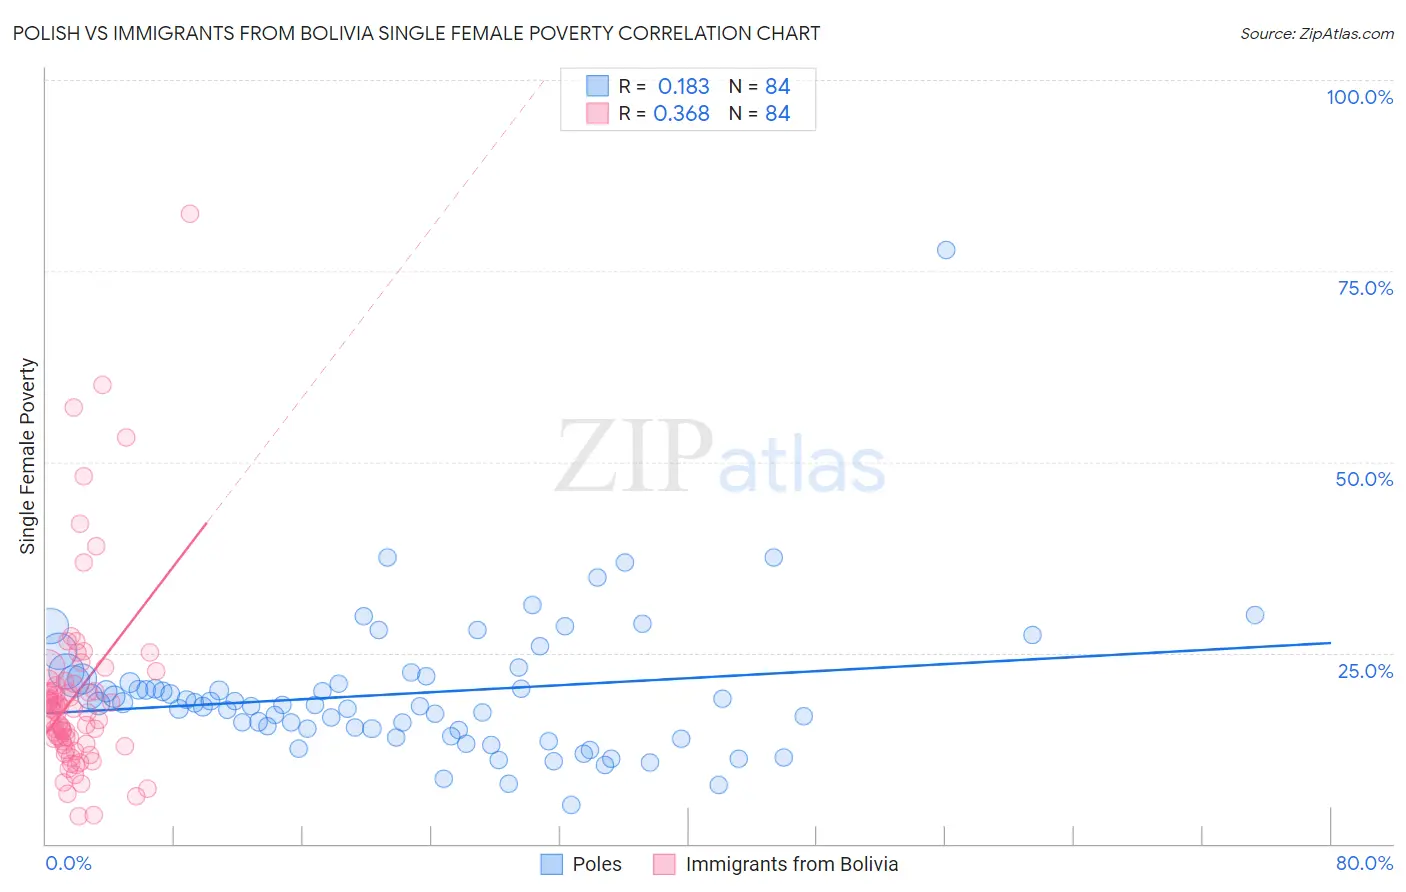
Polish vs Immigrants from Bolivia Single Female Poverty Correlation Chart
The statistical analysis conducted on geographies consisting of 540,648,270 people shows a poor positive correlation between the proportion of Poles and poverty level among single females in the United States with a correlation coefficient (R) of 0.183 and weighted average of 20.0%. Similarly, the statistical analysis conducted on geographies consisting of 157,883,444 people shows a mild positive correlation between the proportion of Immigrants from Bolivia and poverty level among single females in the United States with a correlation coefficient (R) of 0.368 and weighted average of 17.8%, a difference of 12.1%.
Single Female Poverty Correlation Summary
| Measurement | Polish | Immigrants from Bolivia |
| Minimum | 5.1% | 3.6% |
| Maximum | 77.8% | 82.5% |
| Range | 72.7% | 78.9% |
| Mean | 19.6% | 19.6% |
| Median | 18.3% | 17.3% |
| Interquartile 25% (IQ1) | 15.0% | 13.3% |
| Interquartile 75% (IQ3) | 21.4% | 20.9% |
| Interquartile Range (IQR) | 6.4% | 7.6% |
| Standard Deviation (Sample) | 9.3% | 12.6% |
| Standard Deviation (Population) | 9.3% | 12.5% |
Similar Demographics by Single Female Poverty
Demographics Similar to Poles by Single Female Poverty
In terms of single female poverty, the demographic groups most similar to Poles are Immigrants from Kazakhstan (20.0%, a difference of 0.050%), Immigrants from Northern Africa (20.0%, a difference of 0.080%), Immigrants from Afghanistan (20.0%, a difference of 0.080%), Immigrants from Ethiopia (20.0%, a difference of 0.080%), and Immigrants from Zimbabwe (20.0%, a difference of 0.10%).
| Demographics | Rating | Rank | Single Female Poverty |
| Immigrants | Western Asia | 96.5 /100 | #110 | Exceptional 19.9% |
| Carpatho Rusyns | 96.1 /100 | #111 | Exceptional 20.0% |
| Immigrants | Netherlands | 96.0 /100 | #112 | Exceptional 20.0% |
| Immigrants | Zimbabwe | 95.9 /100 | #113 | Exceptional 20.0% |
| Immigrants | Colombia | 95.9 /100 | #114 | Exceptional 20.0% |
| Immigrants | Northern Africa | 95.8 /100 | #115 | Exceptional 20.0% |
| Immigrants | Kazakhstan | 95.7 /100 | #116 | Exceptional 20.0% |
| Poles | 95.6 /100 | #117 | Exceptional 20.0% |
| Immigrants | Afghanistan | 95.4 /100 | #118 | Exceptional 20.0% |
| Immigrants | Ethiopia | 95.4 /100 | #119 | Exceptional 20.0% |
| South Americans | 95.1 /100 | #120 | Exceptional 20.0% |
| Immigrants | Switzerland | 95.1 /100 | #121 | Exceptional 20.0% |
| Immigrants | South America | 95.0 /100 | #122 | Exceptional 20.0% |
| Brazilians | 94.4 /100 | #123 | Exceptional 20.1% |
| Immigrants | Chile | 94.3 /100 | #124 | Exceptional 20.1% |
Demographics Similar to Immigrants from Bolivia by Single Female Poverty
In terms of single female poverty, the demographic groups most similar to Immigrants from Bolivia are Immigrants from South Central Asia (17.8%, a difference of 0.26%), Immigrants from Lithuania (17.8%, a difference of 0.32%), Immigrants from Ireland (17.8%, a difference of 0.41%), Bolivian (17.9%, a difference of 0.44%), and Indian (Asian) (17.9%, a difference of 0.59%).
| Demographics | Rating | Rank | Single Female Poverty |
| Filipinos | 100.0 /100 | #6 | Exceptional 17.0% |
| Thais | 100.0 /100 | #7 | Exceptional 17.3% |
| Immigrants | Iran | 100.0 /100 | #8 | Exceptional 17.5% |
| Bhutanese | 100.0 /100 | #9 | Exceptional 17.7% |
| Immigrants | Ireland | 100.0 /100 | #10 | Exceptional 17.8% |
| Immigrants | Lithuania | 100.0 /100 | #11 | Exceptional 17.8% |
| Immigrants | South Central Asia | 100.0 /100 | #12 | Exceptional 17.8% |
| Immigrants | Bolivia | 100.0 /100 | #13 | Exceptional 17.8% |
| Bolivians | 100.0 /100 | #14 | Exceptional 17.9% |
| Indians (Asian) | 100.0 /100 | #15 | Exceptional 17.9% |
| Iranians | 100.0 /100 | #16 | Exceptional 18.0% |
| Immigrants | Korea | 100.0 /100 | #17 | Exceptional 18.1% |
| Immigrants | Eastern Asia | 100.0 /100 | #18 | Exceptional 18.1% |
| Immigrants | China | 100.0 /100 | #19 | Exceptional 18.1% |
| Immigrants | Greece | 100.0 /100 | #20 | Exceptional 18.3% |