Pima vs Laotian Seniors Poverty Over the Age of 65
COMPARE
Pima
Laotian
Seniors Poverty Over the Age of 65
Seniors Poverty Over the Age of 65 Comparison
Pima
Laotians
19.8%
SENIORS POVERTY OVER THE AGE OF 65
0.0/ 100
METRIC RATING
345th/ 347
METRIC RANK
10.6%
SENIORS POVERTY OVER THE AGE OF 65
79.9/ 100
METRIC RATING
145th/ 347
METRIC RANK
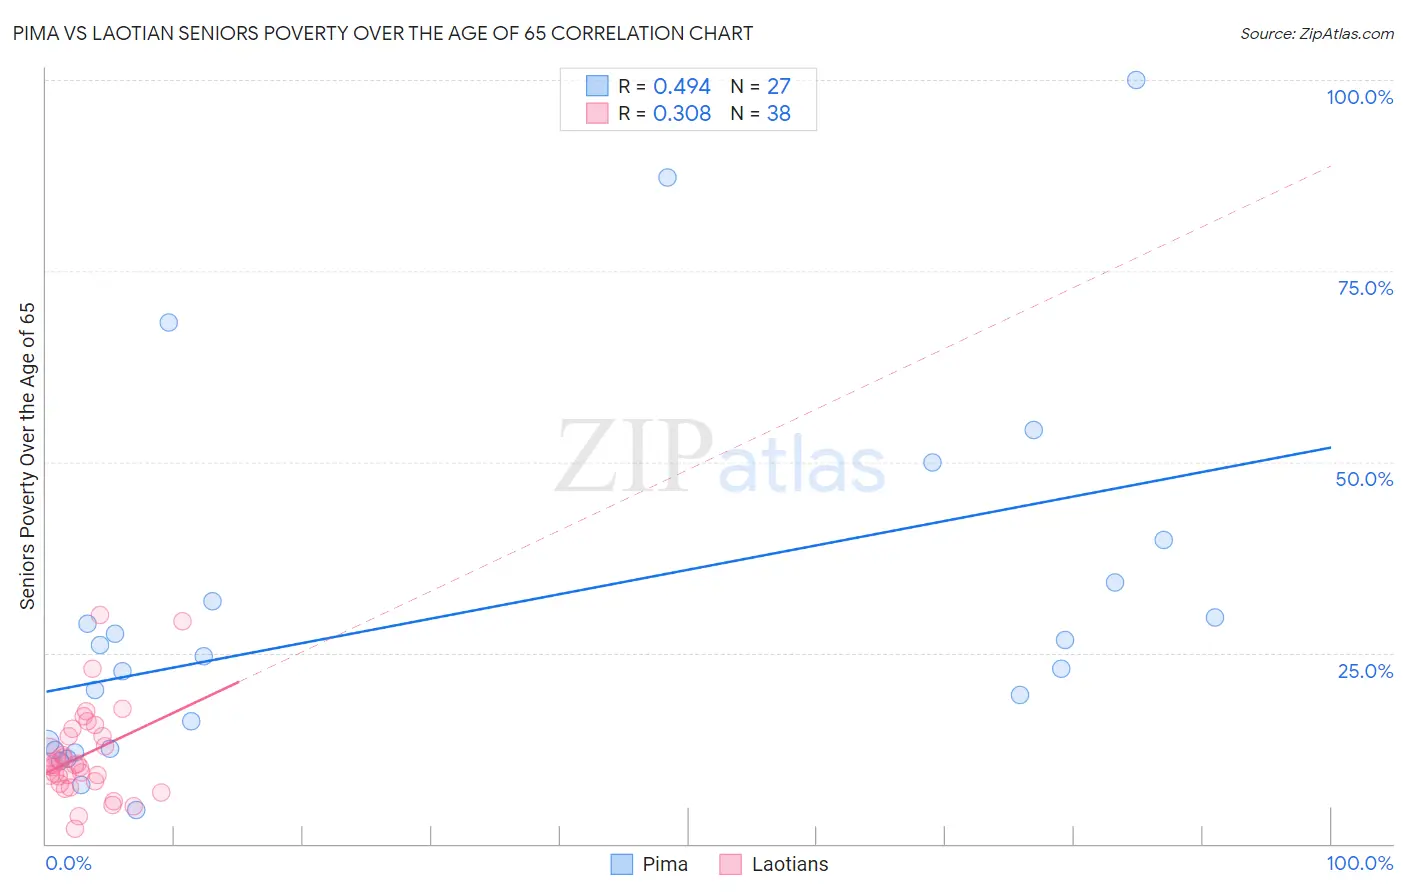
Pima vs Laotian Seniors Poverty Over the Age of 65 Correlation Chart
The statistical analysis conducted on geographies consisting of 61,518,607 people shows a moderate positive correlation between the proportion of Pima and poverty level among seniors over the age of 65 in the United States with a correlation coefficient (R) of 0.494 and weighted average of 19.8%. Similarly, the statistical analysis conducted on geographies consisting of 224,417,666 people shows a mild positive correlation between the proportion of Laotians and poverty level among seniors over the age of 65 in the United States with a correlation coefficient (R) of 0.308 and weighted average of 10.6%, a difference of 86.9%.
Seniors Poverty Over the Age of 65 Correlation Summary
| Measurement | Pima | Laotian |
| Minimum | 4.4% | 2.0% |
| Maximum | 100.0% | 29.9% |
| Range | 95.6% | 27.9% |
| Mean | 30.1% | 11.6% |
| Median | 24.6% | 10.4% |
| Interquartile 25% (IQ1) | 12.4% | 8.3% |
| Interquartile 75% (IQ3) | 34.3% | 14.1% |
| Interquartile Range (IQR) | 21.8% | 5.9% |
| Standard Deviation (Sample) | 23.6% | 6.0% |
| Standard Deviation (Population) | 23.1% | 6.0% |
Similar Demographics by Seniors Poverty Over the Age of 65
Demographics Similar to Pima by Seniors Poverty Over the Age of 65
In terms of seniors poverty over the age of 65, the demographic groups most similar to Pima are Tohono O'odham (20.8%, a difference of 5.2%), Puerto Rican (21.4%, a difference of 8.1%), Immigrants from Dominican Republic (18.3%, a difference of 8.3%), Lumbee (18.1%, a difference of 9.3%), and Immigrants from Cuba (17.9%, a difference of 10.4%).
| Demographics | Rating | Rank | Seniors Poverty Over the Age of 65 |
| Immigrants | Yemen | 0.0 /100 | #333 | Tragic 15.9% |
| Immigrants | Nicaragua | 0.0 /100 | #334 | Tragic 15.9% |
| Cubans | 0.0 /100 | #335 | Tragic 16.1% |
| Immigrants | Cabo Verde | 0.0 /100 | #336 | Tragic 16.2% |
| Immigrants | Caribbean | 0.0 /100 | #337 | Tragic 16.5% |
| Pueblo | 0.0 /100 | #338 | Tragic 17.2% |
| Navajo | 0.0 /100 | #339 | Tragic 17.5% |
| Hopi | 0.0 /100 | #340 | Tragic 17.8% |
| Dominicans | 0.0 /100 | #341 | Tragic 17.8% |
| Immigrants | Cuba | 0.0 /100 | #342 | Tragic 17.9% |
| Lumbee | 0.0 /100 | #343 | Tragic 18.1% |
| Immigrants | Dominican Republic | 0.0 /100 | #344 | Tragic 18.3% |
| Pima | 0.0 /100 | #345 | Tragic 19.8% |
| Tohono O'odham | 0.0 /100 | #346 | Tragic 20.8% |
| Puerto Ricans | 0.0 /100 | #347 | Tragic 21.4% |
Demographics Similar to Laotians by Seniors Poverty Over the Age of 65
In terms of seniors poverty over the age of 65, the demographic groups most similar to Laotians are Alaskan Athabascan (10.6%, a difference of 0.10%), Iraqi (10.6%, a difference of 0.12%), Immigrants from Greece (10.6%, a difference of 0.12%), Immigrants from Asia (10.6%, a difference of 0.13%), and American (10.6%, a difference of 0.25%).
| Demographics | Rating | Rank | Seniors Poverty Over the Age of 65 |
| Immigrants | Latvia | 84.7 /100 | #138 | Excellent 10.5% |
| Portuguese | 84.1 /100 | #139 | Excellent 10.5% |
| Immigrants | Kenya | 83.4 /100 | #140 | Excellent 10.5% |
| Immigrants | Europe | 83.3 /100 | #141 | Excellent 10.5% |
| Osage | 82.8 /100 | #142 | Excellent 10.6% |
| Immigrants | Asia | 80.8 /100 | #143 | Excellent 10.6% |
| Iraqis | 80.7 /100 | #144 | Excellent 10.6% |
| Laotians | 79.9 /100 | #145 | Good 10.6% |
| Alaskan Athabascans | 79.1 /100 | #146 | Good 10.6% |
| Immigrants | Greece | 79.0 /100 | #147 | Good 10.6% |
| Americans | 78.1 /100 | #148 | Good 10.6% |
| Immigrants | Cameroon | 78.1 /100 | #149 | Good 10.6% |
| Immigrants | Switzerland | 77.3 /100 | #150 | Good 10.6% |
| Spanish | 76.8 /100 | #151 | Good 10.6% |
| Immigrants | Egypt | 76.5 /100 | #152 | Good 10.6% |