Pennsylvania German vs Lithuanian Receiving Food Stamps
COMPARE
Pennsylvania German
Lithuanian
Receiving Food Stamps
Receiving Food Stamps Comparison
Pennsylvania Germans
Lithuanians
11.4%
RECEIVING FOOD STAMPS
68.4/ 100
METRIC RATING
161st/ 347
METRIC RANK
9.7%
RECEIVING FOOD STAMPS
99.4/ 100
METRIC RATING
50th/ 347
METRIC RANK
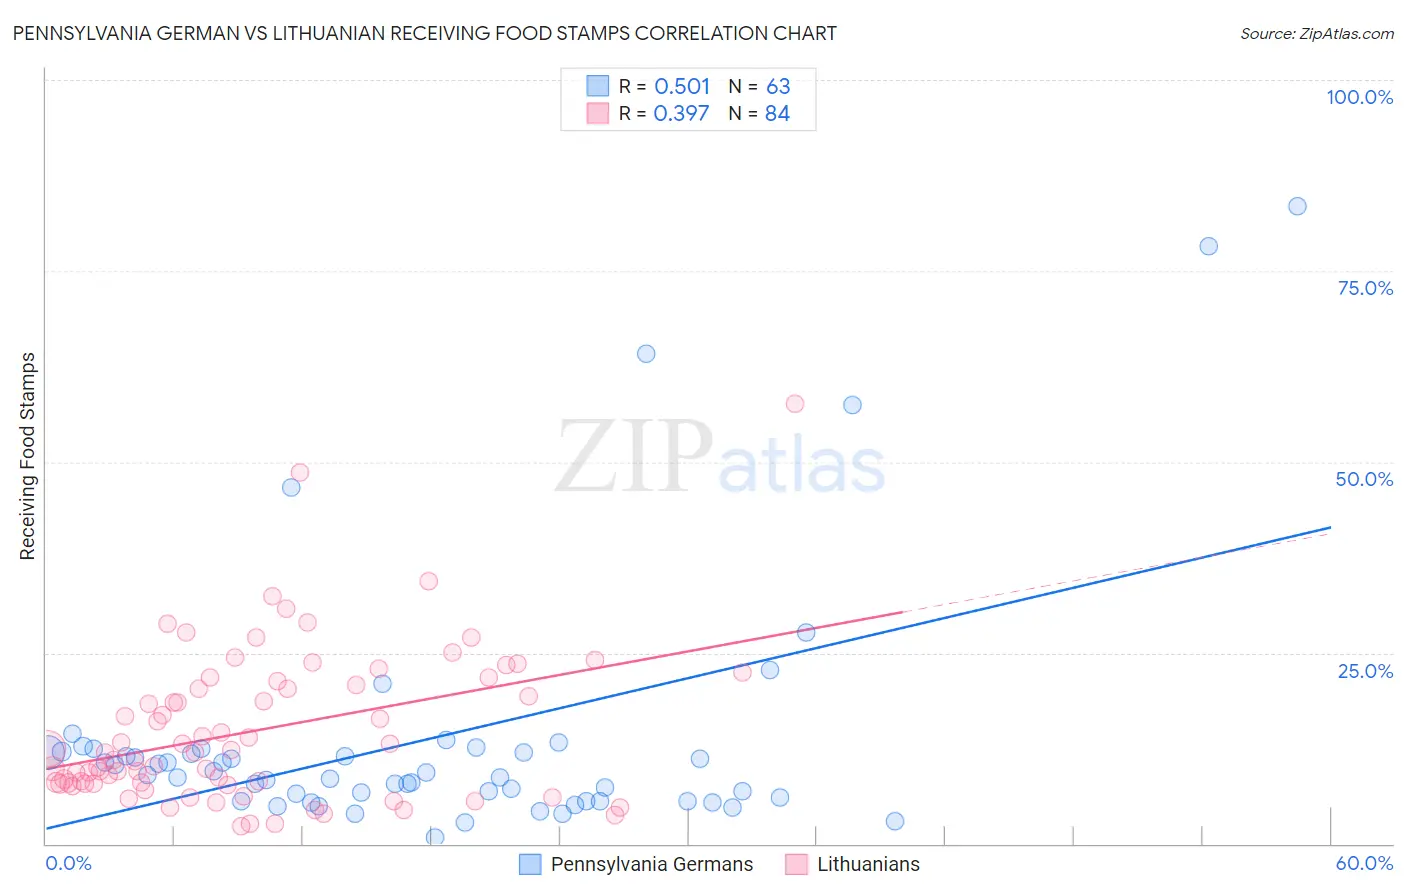
Pennsylvania German vs Lithuanian Receiving Food Stamps Correlation Chart
The statistical analysis conducted on geographies consisting of 233,858,684 people shows a substantial positive correlation between the proportion of Pennsylvania Germans and percentage of population receiving government assistance and/or food stamps in the United States with a correlation coefficient (R) of 0.501 and weighted average of 11.4%. Similarly, the statistical analysis conducted on geographies consisting of 420,339,892 people shows a mild positive correlation between the proportion of Lithuanians and percentage of population receiving government assistance and/or food stamps in the United States with a correlation coefficient (R) of 0.397 and weighted average of 9.7%, a difference of 18.1%.
Receiving Food Stamps Correlation Summary
| Measurement | Pennsylvania German | Lithuanian |
| Minimum | 0.90% | 2.4% |
| Maximum | 83.5% | 57.6% |
| Range | 82.6% | 55.2% |
| Mean | 13.7% | 14.8% |
| Median | 8.9% | 11.9% |
| Interquartile 25% (IQ1) | 5.6% | 7.9% |
| Interquartile 75% (IQ3) | 12.0% | 21.0% |
| Interquartile Range (IQR) | 6.4% | 13.1% |
| Standard Deviation (Sample) | 16.6% | 10.0% |
| Standard Deviation (Population) | 16.4% | 10.0% |
Similar Demographics by Receiving Food Stamps
Demographics Similar to Pennsylvania Germans by Receiving Food Stamps
In terms of receiving food stamps, the demographic groups most similar to Pennsylvania Germans are Alsatian (11.4%, a difference of 0.060%), French Canadian (11.4%, a difference of 0.18%), Immigrants from Oceania (11.4%, a difference of 0.34%), Immigrants from Southern Europe (11.5%, a difference of 0.43%), and Immigrants from Chile (11.5%, a difference of 0.55%).
| Demographics | Rating | Rank | Receiving Food Stamps |
| Armenians | 81.4 /100 | #154 | Excellent 11.1% |
| Immigrants | Argentina | 80.4 /100 | #155 | Excellent 11.2% |
| Immigrants | Afghanistan | 75.6 /100 | #156 | Good 11.3% |
| Immigrants | Lebanon | 75.2 /100 | #157 | Good 11.3% |
| Immigrants | Bosnia and Herzegovina | 72.6 /100 | #158 | Good 11.3% |
| Immigrants | Oceania | 70.4 /100 | #159 | Good 11.4% |
| French Canadians | 69.5 /100 | #160 | Good 11.4% |
| Pennsylvania Germans | 68.4 /100 | #161 | Good 11.4% |
| Alsatians | 68.0 /100 | #162 | Good 11.4% |
| Immigrants | Southern Europe | 65.8 /100 | #163 | Good 11.5% |
| Immigrants | Chile | 65.0 /100 | #164 | Good 11.5% |
| Arabs | 64.7 /100 | #165 | Good 11.5% |
| Immigrants | Belarus | 62.8 /100 | #166 | Good 11.5% |
| Kenyans | 60.2 /100 | #167 | Good 11.6% |
| Tlingit-Haida | 59.1 /100 | #168 | Average 11.6% |
Demographics Similar to Lithuanians by Receiving Food Stamps
In terms of receiving food stamps, the demographic groups most similar to Lithuanians are Asian (9.7%, a difference of 0.18%), Immigrants from South Africa (9.7%, a difference of 0.19%), Tongan (9.7%, a difference of 0.21%), Immigrants from Czechoslovakia (9.6%, a difference of 0.25%), and Russian (9.6%, a difference of 0.27%).
| Demographics | Rating | Rank | Receiving Food Stamps |
| Croatians | 99.5 /100 | #43 | Exceptional 9.6% |
| Immigrants | Denmark | 99.4 /100 | #44 | Exceptional 9.6% |
| Immigrants | Belgium | 99.4 /100 | #45 | Exceptional 9.6% |
| Australians | 99.4 /100 | #46 | Exceptional 9.6% |
| Indians (Asian) | 99.4 /100 | #47 | Exceptional 9.6% |
| Russians | 99.4 /100 | #48 | Exceptional 9.6% |
| Immigrants | Czechoslovakia | 99.4 /100 | #49 | Exceptional 9.6% |
| Lithuanians | 99.4 /100 | #50 | Exceptional 9.7% |
| Asians | 99.3 /100 | #51 | Exceptional 9.7% |
| Immigrants | South Africa | 99.3 /100 | #52 | Exceptional 9.7% |
| Tongans | 99.3 /100 | #53 | Exceptional 9.7% |
| Swiss | 99.3 /100 | #54 | Exceptional 9.7% |
| Immigrants | Switzerland | 99.3 /100 | #55 | Exceptional 9.7% |
| Immigrants | Canada | 99.3 /100 | #56 | Exceptional 9.7% |
| Greeks | 99.3 /100 | #57 | Exceptional 9.7% |