Immigrants from Belgium vs Lithuanian Receiving Food Stamps
COMPARE
Immigrants from Belgium
Lithuanian
Receiving Food Stamps
Receiving Food Stamps Comparison
Immigrants from Belgium
Lithuanians
9.6%
RECEIVING FOOD STAMPS
99.4/ 100
METRIC RATING
45th/ 347
METRIC RANK
9.7%
RECEIVING FOOD STAMPS
99.4/ 100
METRIC RATING
50th/ 347
METRIC RANK
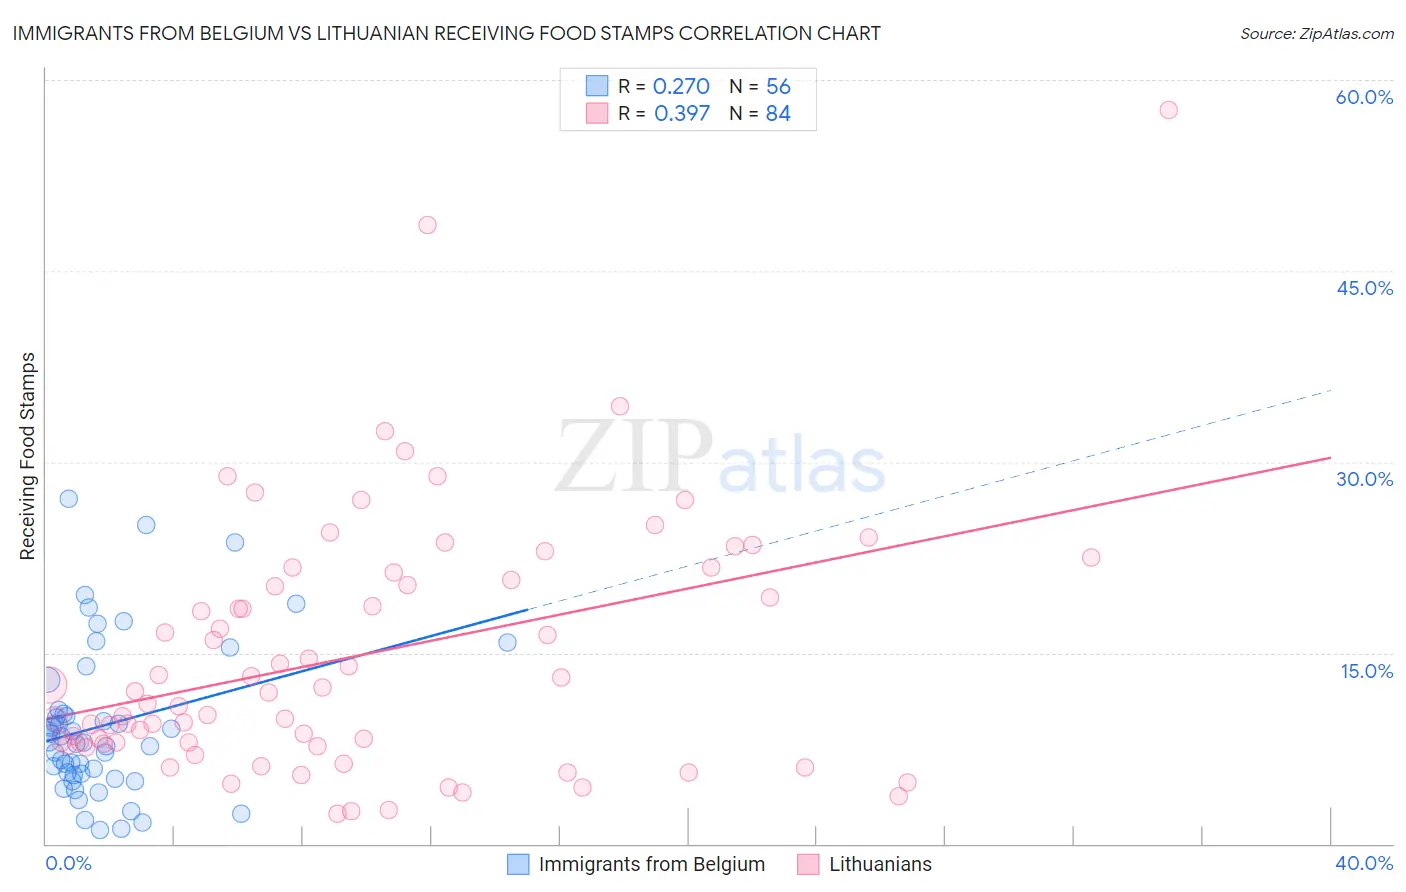
Immigrants from Belgium vs Lithuanian Receiving Food Stamps Correlation Chart
The statistical analysis conducted on geographies consisting of 146,482,821 people shows a weak positive correlation between the proportion of Immigrants from Belgium and percentage of population receiving government assistance and/or food stamps in the United States with a correlation coefficient (R) of 0.270 and weighted average of 9.6%. Similarly, the statistical analysis conducted on geographies consisting of 420,339,892 people shows a mild positive correlation between the proportion of Lithuanians and percentage of population receiving government assistance and/or food stamps in the United States with a correlation coefficient (R) of 0.397 and weighted average of 9.7%, a difference of 0.52%.
Receiving Food Stamps Correlation Summary
| Measurement | Immigrants from Belgium | Lithuanian |
| Minimum | 1.1% | 2.4% |
| Maximum | 27.1% | 57.6% |
| Range | 26.0% | 55.2% |
| Mean | 9.3% | 14.8% |
| Median | 8.0% | 11.9% |
| Interquartile 25% (IQ1) | 5.5% | 7.9% |
| Interquartile 75% (IQ3) | 10.4% | 21.0% |
| Interquartile Range (IQR) | 4.9% | 13.1% |
| Standard Deviation (Sample) | 6.0% | 10.0% |
| Standard Deviation (Population) | 5.9% | 10.0% |
Demographics Similar to Immigrants from Belgium and Lithuanians by Receiving Food Stamps
In terms of receiving food stamps, the demographic groups most similar to Immigrants from Belgium are Immigrants from Denmark (9.6%, a difference of 0.030%), Australian (9.6%, a difference of 0.080%), Indian (Asian) (9.6%, a difference of 0.15%), Russian (9.6%, a difference of 0.25%), and Croatian (9.6%, a difference of 0.26%). Similarly, the demographic groups most similar to Lithuanians are Asian (9.7%, a difference of 0.18%), Immigrants from South Africa (9.7%, a difference of 0.19%), Tongan (9.7%, a difference of 0.21%), Immigrants from Czechoslovakia (9.6%, a difference of 0.25%), and Russian (9.6%, a difference of 0.27%).
| Demographics | Rating | Rank | Receiving Food Stamps |
| Europeans | 99.6 /100 | #37 | Exceptional 9.5% |
| Immigrants | Sri Lanka | 99.5 /100 | #38 | Exceptional 9.5% |
| Immigrants | Bolivia | 99.5 /100 | #39 | Exceptional 9.5% |
| Immigrants | Netherlands | 99.5 /100 | #40 | Exceptional 9.5% |
| Cambodians | 99.5 /100 | #41 | Exceptional 9.5% |
| Immigrants | China | 99.5 /100 | #42 | Exceptional 9.6% |
| Croatians | 99.5 /100 | #43 | Exceptional 9.6% |
| Immigrants | Denmark | 99.4 /100 | #44 | Exceptional 9.6% |
| Immigrants | Belgium | 99.4 /100 | #45 | Exceptional 9.6% |
| Australians | 99.4 /100 | #46 | Exceptional 9.6% |
| Indians (Asian) | 99.4 /100 | #47 | Exceptional 9.6% |
| Russians | 99.4 /100 | #48 | Exceptional 9.6% |
| Immigrants | Czechoslovakia | 99.4 /100 | #49 | Exceptional 9.6% |
| Lithuanians | 99.4 /100 | #50 | Exceptional 9.7% |
| Asians | 99.3 /100 | #51 | Exceptional 9.7% |
| Immigrants | South Africa | 99.3 /100 | #52 | Exceptional 9.7% |
| Tongans | 99.3 /100 | #53 | Exceptional 9.7% |
| Swiss | 99.3 /100 | #54 | Exceptional 9.7% |
| Immigrants | Switzerland | 99.3 /100 | #55 | Exceptional 9.7% |
| Immigrants | Canada | 99.3 /100 | #56 | Exceptional 9.7% |
| Greeks | 99.3 /100 | #57 | Exceptional 9.7% |