Paraguayan vs Immigrants from China Child Poverty Under the Age of 5
COMPARE
Paraguayan
Immigrants from China
Child Poverty Under the Age of 5
Child Poverty Under the Age of 5 Comparison
Paraguayans
Immigrants from China
15.0%
CHILD POVERTY UNDER THE AGE OF 5
99.4/ 100
METRIC RATING
59th/ 347
METRIC RANK
13.6%
CHILD POVERTY UNDER THE AGE OF 5
100.0/ 100
METRIC RATING
18th/ 347
METRIC RANK
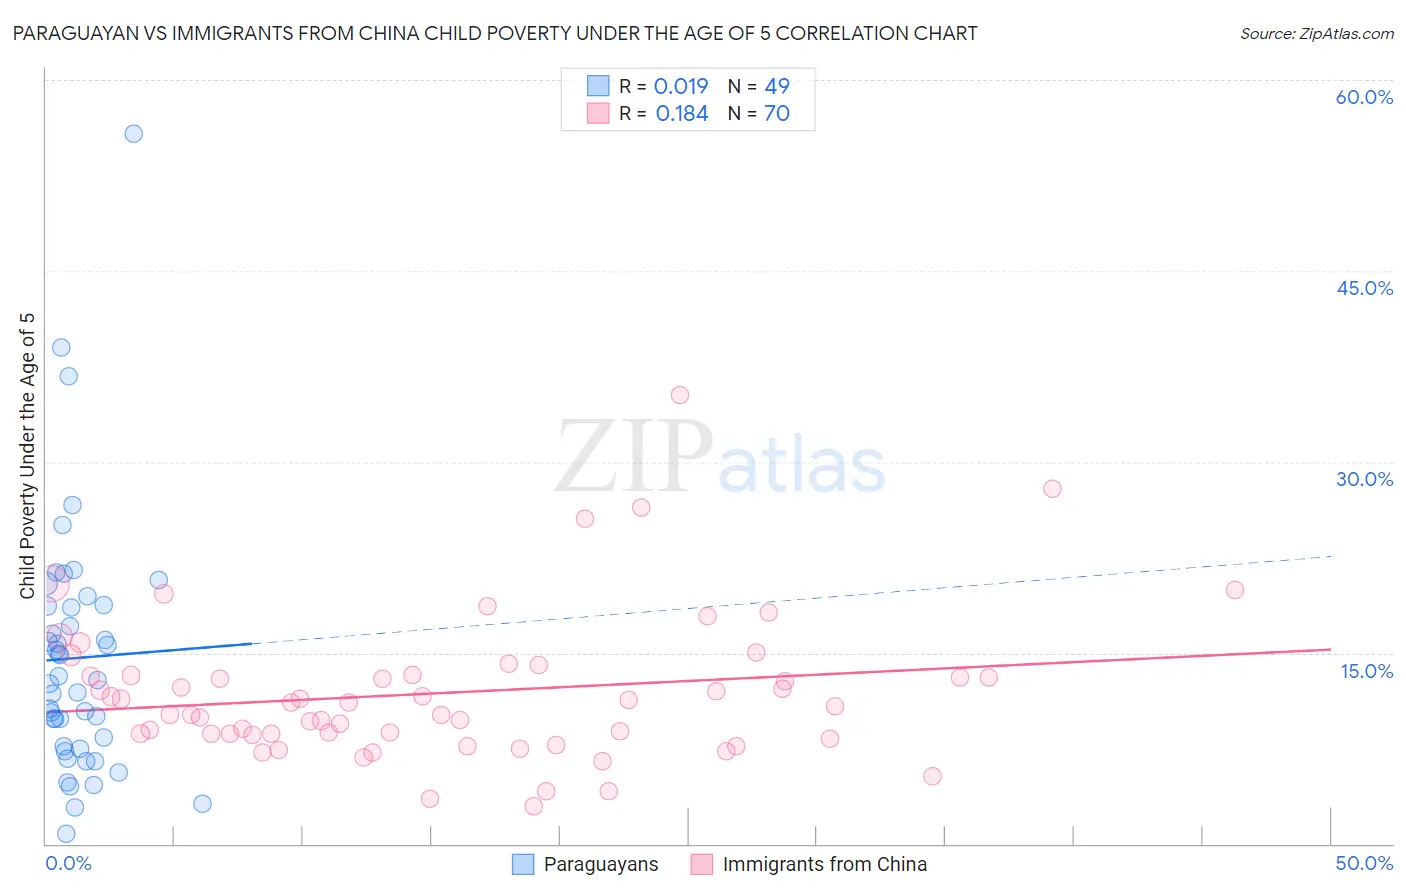
Paraguayan vs Immigrants from China Child Poverty Under the Age of 5 Correlation Chart
The statistical analysis conducted on geographies consisting of 93,489,303 people shows no correlation between the proportion of Paraguayans and poverty level among children under the age of 5 in the United States with a correlation coefficient (R) of 0.019 and weighted average of 15.0%. Similarly, the statistical analysis conducted on geographies consisting of 433,139,374 people shows a poor positive correlation between the proportion of Immigrants from China and poverty level among children under the age of 5 in the United States with a correlation coefficient (R) of 0.184 and weighted average of 13.6%, a difference of 10.1%.
Child Poverty Under the Age of 5 Correlation Summary
| Measurement | Paraguayan | Immigrants from China |
| Minimum | 0.83% | 2.9% |
| Maximum | 55.8% | 35.3% |
| Range | 54.9% | 32.4% |
| Mean | 14.6% | 11.9% |
| Median | 12.8% | 10.9% |
| Interquartile 25% (IQ1) | 7.6% | 8.6% |
| Interquartile 75% (IQ3) | 18.7% | 13.2% |
| Interquartile Range (IQR) | 11.1% | 4.6% |
| Standard Deviation (Sample) | 9.9% | 5.7% |
| Standard Deviation (Population) | 9.8% | 5.7% |
Similar Demographics by Child Poverty Under the Age of 5
Demographics Similar to Paraguayans by Child Poverty Under the Age of 5
In terms of child poverty under the age of 5, the demographic groups most similar to Paraguayans are Immigrants from Russia (15.0%, a difference of 0.090%), Swedish (15.0%, a difference of 0.15%), Egyptian (14.9%, a difference of 0.20%), Immigrants from Pakistan (14.9%, a difference of 0.28%), and Danish (14.9%, a difference of 0.35%).
| Demographics | Rating | Rank | Child Poverty Under the Age of 5 |
| Immigrants | Serbia | 99.5 /100 | #52 | Exceptional 14.9% |
| Luxembourgers | 99.4 /100 | #53 | Exceptional 14.9% |
| Immigrants | Israel | 99.4 /100 | #54 | Exceptional 14.9% |
| Danes | 99.4 /100 | #55 | Exceptional 14.9% |
| Immigrants | Pakistan | 99.4 /100 | #56 | Exceptional 14.9% |
| Egyptians | 99.4 /100 | #57 | Exceptional 14.9% |
| Swedes | 99.4 /100 | #58 | Exceptional 15.0% |
| Paraguayans | 99.4 /100 | #59 | Exceptional 15.0% |
| Immigrants | Russia | 99.3 /100 | #60 | Exceptional 15.0% |
| Immigrants | Poland | 99.1 /100 | #61 | Exceptional 15.1% |
| Immigrants | Eastern Europe | 99.1 /100 | #62 | Exceptional 15.1% |
| Immigrants | Europe | 99.1 /100 | #63 | Exceptional 15.1% |
| Immigrants | Romania | 99.1 /100 | #64 | Exceptional 15.2% |
| Immigrants | Fiji | 99.0 /100 | #65 | Exceptional 15.2% |
| Immigrants | Scotland | 99.0 /100 | #66 | Exceptional 15.2% |
Demographics Similar to Immigrants from China by Child Poverty Under the Age of 5
In terms of child poverty under the age of 5, the demographic groups most similar to Immigrants from China are Assyrian/Chaldean/Syriac (13.6%, a difference of 0.29%), Immigrants from Eastern Asia (13.5%, a difference of 0.63%), Immigrants from Ireland (13.7%, a difference of 0.88%), Indian (Asian) (13.4%, a difference of 1.1%), and Okinawan (13.4%, a difference of 1.2%).
| Demographics | Rating | Rank | Child Poverty Under the Age of 5 |
| Immigrants | Korea | 100.0 /100 | #11 | Exceptional 13.2% |
| Immigrants | South Central Asia | 100.0 /100 | #12 | Exceptional 13.3% |
| Bhutanese | 100.0 /100 | #13 | Exceptional 13.4% |
| Okinawans | 100.0 /100 | #14 | Exceptional 13.4% |
| Indians (Asian) | 100.0 /100 | #15 | Exceptional 13.4% |
| Immigrants | Eastern Asia | 100.0 /100 | #16 | Exceptional 13.5% |
| Assyrians/Chaldeans/Syriacs | 100.0 /100 | #17 | Exceptional 13.6% |
| Immigrants | China | 100.0 /100 | #18 | Exceptional 13.6% |
| Immigrants | Ireland | 100.0 /100 | #19 | Exceptional 13.7% |
| Immigrants | Japan | 100.0 /100 | #20 | Exceptional 13.8% |
| Bolivians | 100.0 /100 | #21 | Exceptional 13.8% |
| Immigrants | Bolivia | 100.0 /100 | #22 | Exceptional 13.8% |
| Bulgarians | 99.9 /100 | #23 | Exceptional 13.9% |
| Asians | 99.9 /100 | #24 | Exceptional 14.0% |
| Cypriots | 99.9 /100 | #25 | Exceptional 14.0% |