Panamanian vs Immigrants from Japan Child Poverty Under the Age of 16
COMPARE
Panamanian
Immigrants from Japan
Child Poverty Under the Age of 16
Child Poverty Under the Age of 16 Comparison
Panamanians
Immigrants from Japan
17.5%
CHILD POVERTY UNDER THE AGE OF 16
6.9/ 100
METRIC RATING
209th/ 347
METRIC RANK
13.0%
CHILD POVERTY UNDER THE AGE OF 16
99.8/ 100
METRIC RATING
19th/ 347
METRIC RANK
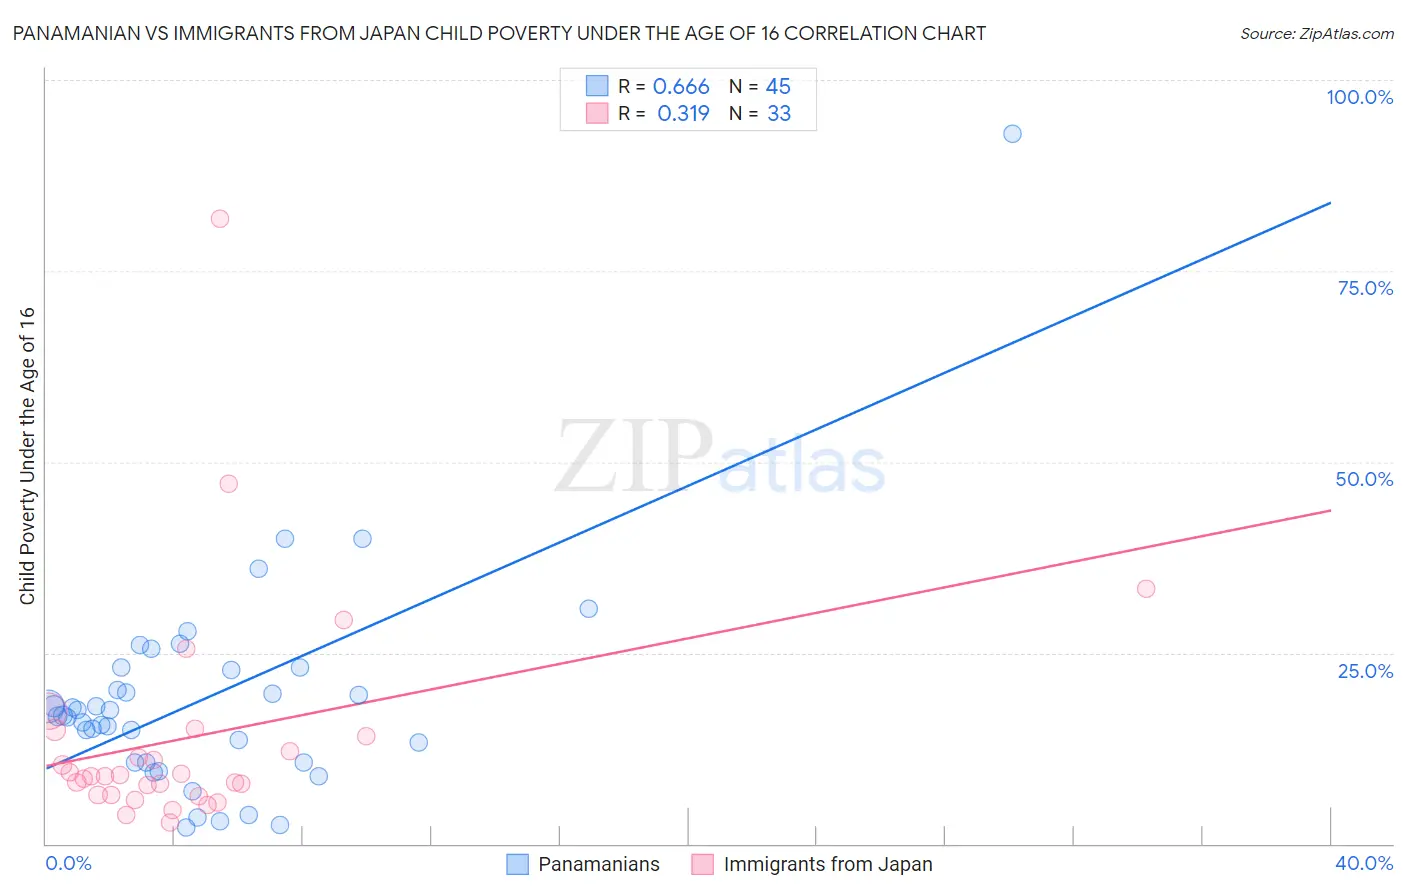
Panamanian vs Immigrants from Japan Child Poverty Under the Age of 16 Correlation Chart
The statistical analysis conducted on geographies consisting of 280,029,681 people shows a significant positive correlation between the proportion of Panamanians and poverty level among children under the age of 16 in the United States with a correlation coefficient (R) of 0.666 and weighted average of 17.5%. Similarly, the statistical analysis conducted on geographies consisting of 337,592,497 people shows a mild positive correlation between the proportion of Immigrants from Japan and poverty level among children under the age of 16 in the United States with a correlation coefficient (R) of 0.319 and weighted average of 13.0%, a difference of 33.9%.
Child Poverty Under the Age of 16 Correlation Summary
| Measurement | Panamanian | Immigrants from Japan |
| Minimum | 2.1% | 2.9% |
| Maximum | 93.0% | 81.8% |
| Range | 90.9% | 79.0% |
| Mean | 18.9% | 14.0% |
| Median | 16.8% | 8.9% |
| Interquartile 25% (IQ1) | 10.7% | 6.4% |
| Interquartile 75% (IQ3) | 22.9% | 14.5% |
| Interquartile Range (IQR) | 12.2% | 8.1% |
| Standard Deviation (Sample) | 14.4% | 15.4% |
| Standard Deviation (Population) | 14.3% | 15.1% |
Similar Demographics by Child Poverty Under the Age of 16
Demographics Similar to Panamanians by Child Poverty Under the Age of 16
In terms of child poverty under the age of 16, the demographic groups most similar to Panamanians are Alaskan Athabascan (17.5%, a difference of 0.010%), Immigrants from Thailand (17.5%, a difference of 0.14%), Immigrants (17.5%, a difference of 0.16%), Pennsylvania German (17.4%, a difference of 0.25%), and Immigrants from the Azores (17.5%, a difference of 0.33%).
| Demographics | Rating | Rank | Child Poverty Under the Age of 16 |
| Ugandans | 14.3 /100 | #202 | Poor 17.1% |
| Immigrants | Sierra Leone | 14.2 /100 | #203 | Poor 17.1% |
| Hmong | 14.0 /100 | #204 | Poor 17.1% |
| Aleuts | 13.9 /100 | #205 | Poor 17.1% |
| Alaska Natives | 11.8 /100 | #206 | Poor 17.2% |
| German Russians | 8.6 /100 | #207 | Tragic 17.4% |
| Pennsylvania Germans | 7.5 /100 | #208 | Tragic 17.4% |
| Panamanians | 6.9 /100 | #209 | Tragic 17.5% |
| Alaskan Athabascans | 6.9 /100 | #210 | Tragic 17.5% |
| Immigrants | Thailand | 6.6 /100 | #211 | Tragic 17.5% |
| Immigrants | Immigrants | 6.5 /100 | #212 | Tragic 17.5% |
| Immigrants | Azores | 6.2 /100 | #213 | Tragic 17.5% |
| Iraqis | 5.9 /100 | #214 | Tragic 17.5% |
| Malaysians | 5.9 /100 | #215 | Tragic 17.5% |
| Sierra Leoneans | 5.7 /100 | #216 | Tragic 17.6% |
Demographics Similar to Immigrants from Japan by Child Poverty Under the Age of 16
In terms of child poverty under the age of 16, the demographic groups most similar to Immigrants from Japan are Cypriot (13.0%, a difference of 0.030%), Bulgarian (13.0%, a difference of 0.45%), Okinawan (13.1%, a difference of 0.59%), Immigrants from Eastern Asia (13.1%, a difference of 0.62%), and Norwegian (13.0%, a difference of 0.68%).
| Demographics | Rating | Rank | Child Poverty Under the Age of 16 |
| Immigrants | Ireland | 99.9 /100 | #12 | Exceptional 12.7% |
| Burmese | 99.9 /100 | #13 | Exceptional 12.8% |
| Immigrants | Lithuania | 99.9 /100 | #14 | Exceptional 12.9% |
| Immigrants | Korea | 99.9 /100 | #15 | Exceptional 13.0% |
| Norwegians | 99.9 /100 | #16 | Exceptional 13.0% |
| Bulgarians | 99.9 /100 | #17 | Exceptional 13.0% |
| Cypriots | 99.9 /100 | #18 | Exceptional 13.0% |
| Immigrants | Japan | 99.8 /100 | #19 | Exceptional 13.0% |
| Okinawans | 99.8 /100 | #20 | Exceptional 13.1% |
| Immigrants | Eastern Asia | 99.8 /100 | #21 | Exceptional 13.1% |
| Maltese | 99.8 /100 | #22 | Exceptional 13.1% |
| Indians (Asian) | 99.8 /100 | #23 | Exceptional 13.1% |
| Latvians | 99.8 /100 | #24 | Exceptional 13.2% |
| Eastern Europeans | 99.8 /100 | #25 | Exceptional 13.2% |
| Bolivians | 99.8 /100 | #26 | Exceptional 13.2% |