Nicaraguan vs Immigrants from Japan Child Poverty Under the Age of 16
COMPARE
Nicaraguan
Immigrants from Japan
Child Poverty Under the Age of 16
Child Poverty Under the Age of 16 Comparison
Nicaraguans
Immigrants from Japan
18.2%
CHILD POVERTY UNDER THE AGE OF 16
1.7/ 100
METRIC RATING
231st/ 347
METRIC RANK
13.0%
CHILD POVERTY UNDER THE AGE OF 16
99.8/ 100
METRIC RATING
19th/ 347
METRIC RANK
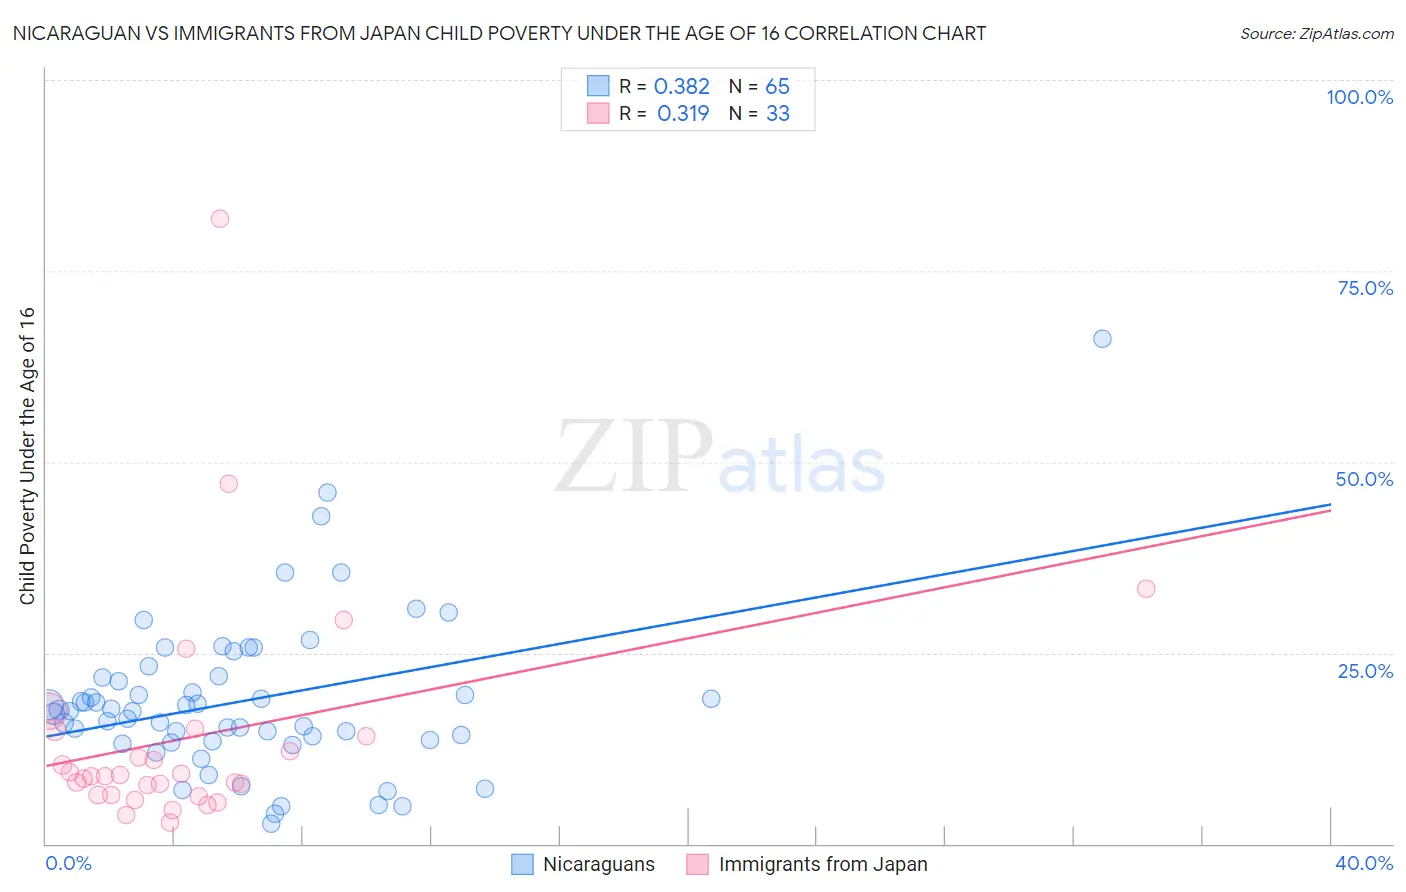
Nicaraguan vs Immigrants from Japan Child Poverty Under the Age of 16 Correlation Chart
The statistical analysis conducted on geographies consisting of 284,786,124 people shows a mild positive correlation between the proportion of Nicaraguans and poverty level among children under the age of 16 in the United States with a correlation coefficient (R) of 0.382 and weighted average of 18.2%. Similarly, the statistical analysis conducted on geographies consisting of 337,592,497 people shows a mild positive correlation between the proportion of Immigrants from Japan and poverty level among children under the age of 16 in the United States with a correlation coefficient (R) of 0.319 and weighted average of 13.0%, a difference of 39.3%.
Child Poverty Under the Age of 16 Correlation Summary
| Measurement | Nicaraguan | Immigrants from Japan |
| Minimum | 2.6% | 2.9% |
| Maximum | 66.2% | 81.8% |
| Range | 63.6% | 79.0% |
| Mean | 18.7% | 14.0% |
| Median | 17.4% | 8.9% |
| Interquartile 25% (IQ1) | 13.5% | 6.4% |
| Interquartile 75% (IQ3) | 21.8% | 14.5% |
| Interquartile Range (IQR) | 8.3% | 8.1% |
| Standard Deviation (Sample) | 10.4% | 15.4% |
| Standard Deviation (Population) | 10.4% | 15.1% |
Similar Demographics by Child Poverty Under the Age of 16
Demographics Similar to Nicaraguans by Child Poverty Under the Age of 16
In terms of child poverty under the age of 16, the demographic groups most similar to Nicaraguans are Nepalese (18.2%, a difference of 0.060%), Marshallese (18.1%, a difference of 0.14%), Immigrants from Micronesia (18.0%, a difference of 0.87%), American (18.3%, a difference of 0.90%), and Immigrants from Africa (18.0%, a difference of 1.0%).
| Demographics | Rating | Rank | Child Poverty Under the Age of 16 |
| Osage | 3.1 /100 | #224 | Tragic 17.9% |
| Immigrants | Nonimmigrants | 2.7 /100 | #225 | Tragic 17.9% |
| Bermudans | 2.6 /100 | #226 | Tragic 18.0% |
| Immigrants | Africa | 2.5 /100 | #227 | Tragic 18.0% |
| Immigrants | Micronesia | 2.3 /100 | #228 | Tragic 18.0% |
| Marshallese | 1.8 /100 | #229 | Tragic 18.1% |
| Nepalese | 1.7 /100 | #230 | Tragic 18.2% |
| Nicaraguans | 1.7 /100 | #231 | Tragic 18.2% |
| Americans | 1.2 /100 | #232 | Tragic 18.3% |
| Fijians | 1.1 /100 | #233 | Tragic 18.4% |
| Immigrants | Nigeria | 1.0 /100 | #234 | Tragic 18.4% |
| Nigerians | 1.0 /100 | #235 | Tragic 18.4% |
| Cree | 0.9 /100 | #236 | Tragic 18.5% |
| Sudanese | 0.9 /100 | #237 | Tragic 18.5% |
| Immigrants | Eritrea | 0.8 /100 | #238 | Tragic 18.5% |
Demographics Similar to Immigrants from Japan by Child Poverty Under the Age of 16
In terms of child poverty under the age of 16, the demographic groups most similar to Immigrants from Japan are Cypriot (13.0%, a difference of 0.030%), Bulgarian (13.0%, a difference of 0.45%), Okinawan (13.1%, a difference of 0.59%), Immigrants from Eastern Asia (13.1%, a difference of 0.62%), and Norwegian (13.0%, a difference of 0.68%).
| Demographics | Rating | Rank | Child Poverty Under the Age of 16 |
| Immigrants | Ireland | 99.9 /100 | #12 | Exceptional 12.7% |
| Burmese | 99.9 /100 | #13 | Exceptional 12.8% |
| Immigrants | Lithuania | 99.9 /100 | #14 | Exceptional 12.9% |
| Immigrants | Korea | 99.9 /100 | #15 | Exceptional 13.0% |
| Norwegians | 99.9 /100 | #16 | Exceptional 13.0% |
| Bulgarians | 99.9 /100 | #17 | Exceptional 13.0% |
| Cypriots | 99.9 /100 | #18 | Exceptional 13.0% |
| Immigrants | Japan | 99.8 /100 | #19 | Exceptional 13.0% |
| Okinawans | 99.8 /100 | #20 | Exceptional 13.1% |
| Immigrants | Eastern Asia | 99.8 /100 | #21 | Exceptional 13.1% |
| Maltese | 99.8 /100 | #22 | Exceptional 13.1% |
| Indians (Asian) | 99.8 /100 | #23 | Exceptional 13.1% |
| Latvians | 99.8 /100 | #24 | Exceptional 13.2% |
| Eastern Europeans | 99.8 /100 | #25 | Exceptional 13.2% |
| Bolivians | 99.8 /100 | #26 | Exceptional 13.2% |